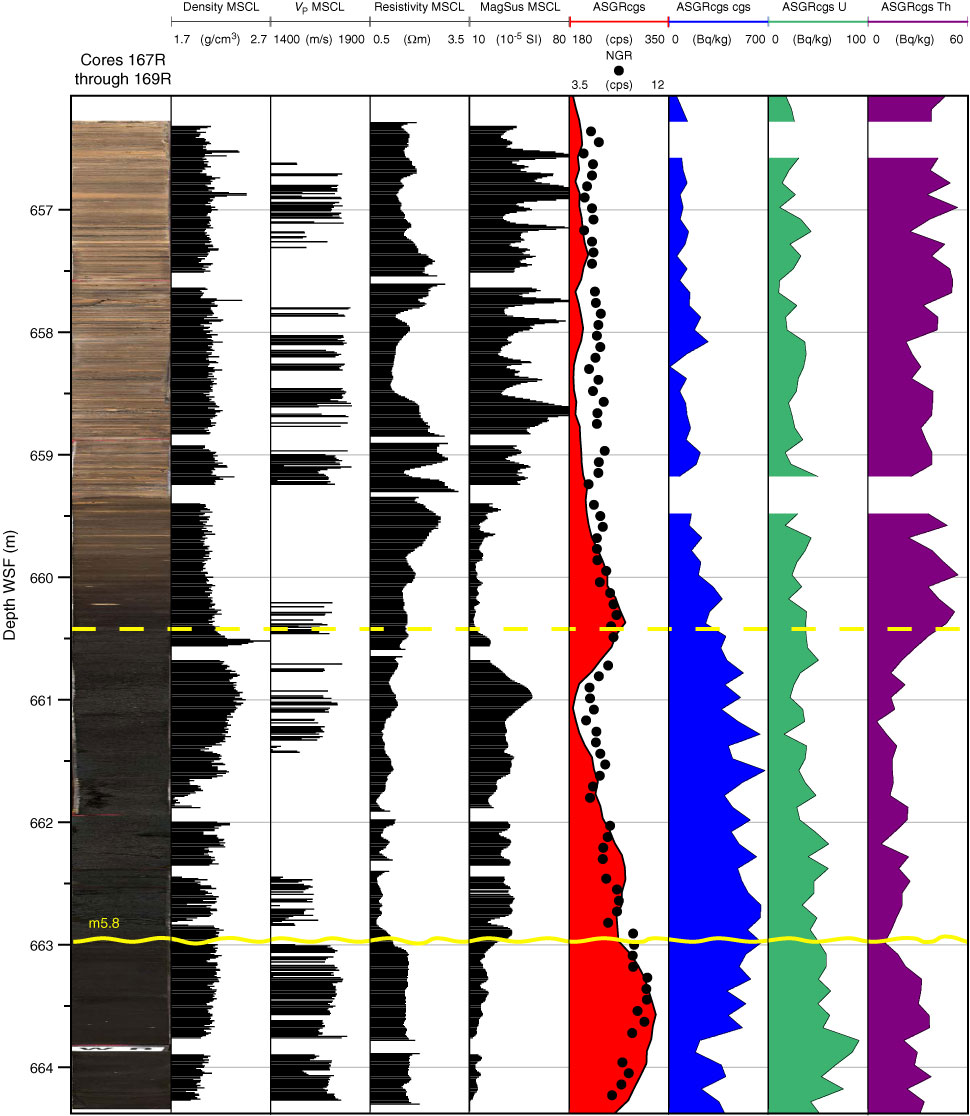
Figure F53. Petrophysical and downhole logging data at the m5.8 boundary in Hole M0028A (Cores 313-M0028A-167R through 169R). Total and spectral gamma ray through pipe (AGSR), along with natural gamma ray (NGR), density, P-wave, resistivity, and magnetic susceptibility from multisensor core logger (MSCL) measurements on cores. Dotted yellow line = base of the tan-colored sand clays described in "Sedimentology;" marks abrupt downward increase in impedance suggesting possible seismic reflector. Wavy yellow line = depth of m5.8 sequence boundary in both cores and petrophysical data (see "Lithostratigraphy").
Previous | Close | Next | Top of page