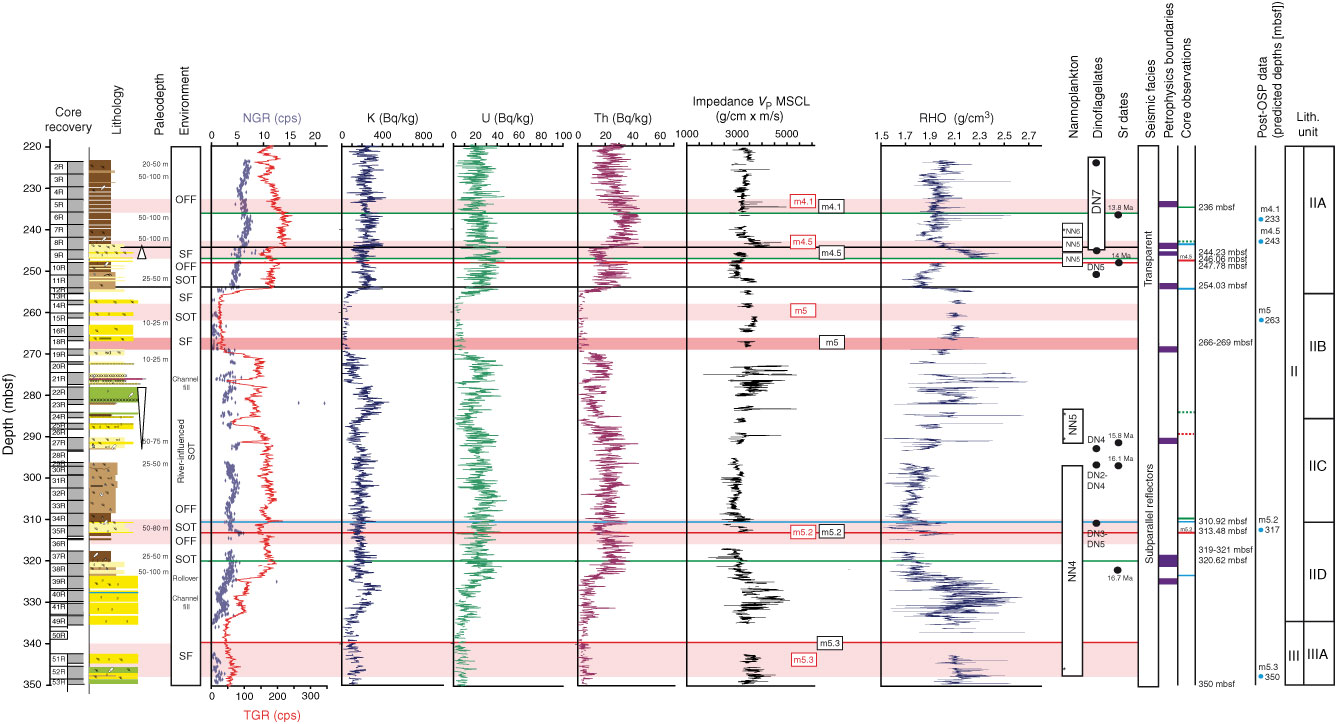
Figure F56. Summary of lithology, lithostratigraphy, well (total gamma ray [TGR], K, U, and Th), and multisensor core logger (MSCL) data (natural gamma radiation [NGR] and bulk density); acoustic impedance calculated using MSCL bulk densities; depositional environments and correlating core surfaces; and predicted depth ranges based on Hole M0028A velocity between 220 and 350 mbsf. OFF = offshore, SF = shoreface, SOT = shoreface–offshore transition. Blue dots = NGR, red line = TGR. See Figure F1 for lithology legend.
Previous | Close | Next | Top of page