Previous | Close | Next
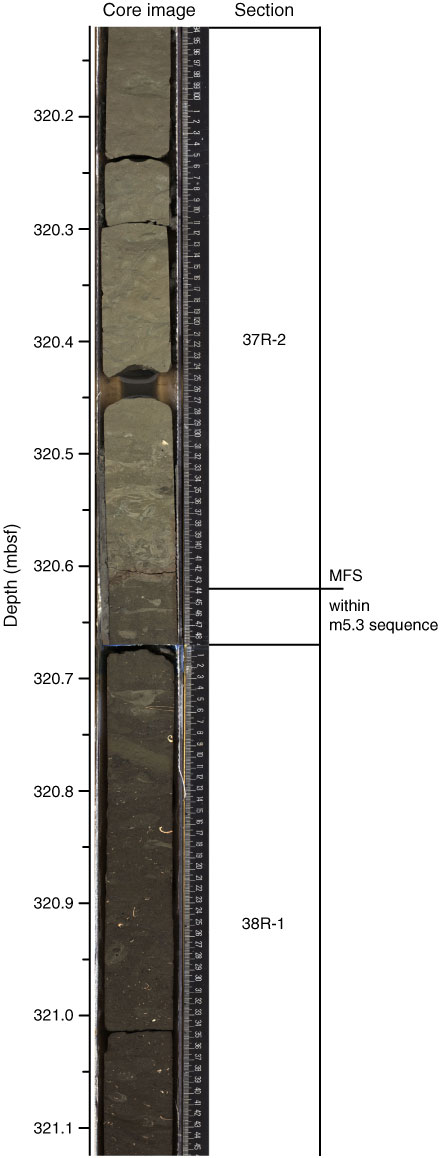
Figure F60. Correlation of core image with interpretation of deposition and age, 320.2–321.1 mbsf. MFS = maximum flooding surface.
Previous | Close | Next | Top of page