Previous | Close | Next
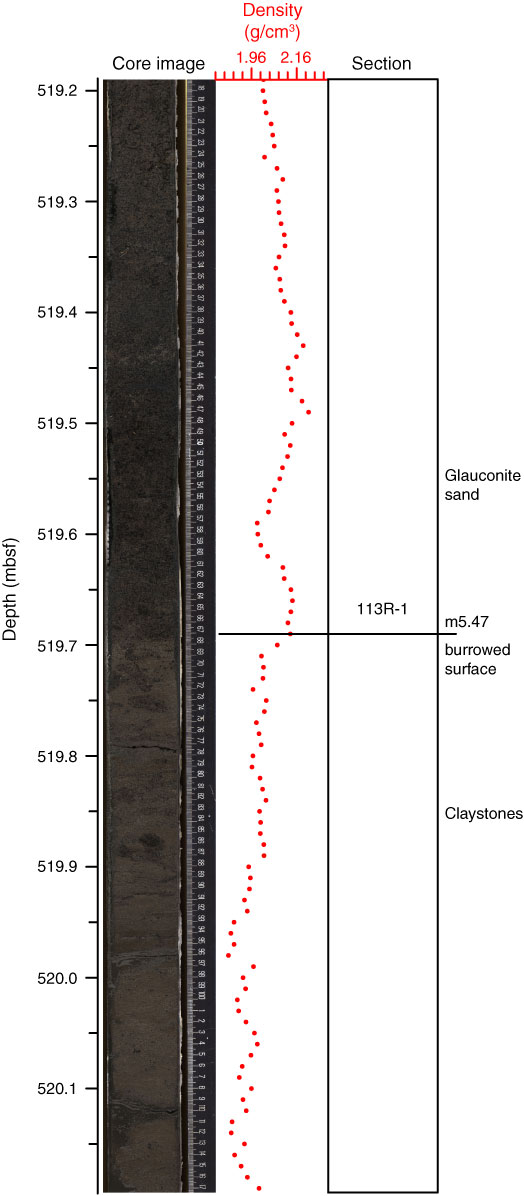
Figure F63. Correlation of core image with interpretation of deposition and age along with density, 519.2–520.1 mbsf.
Previous | Close | Next | Top of page