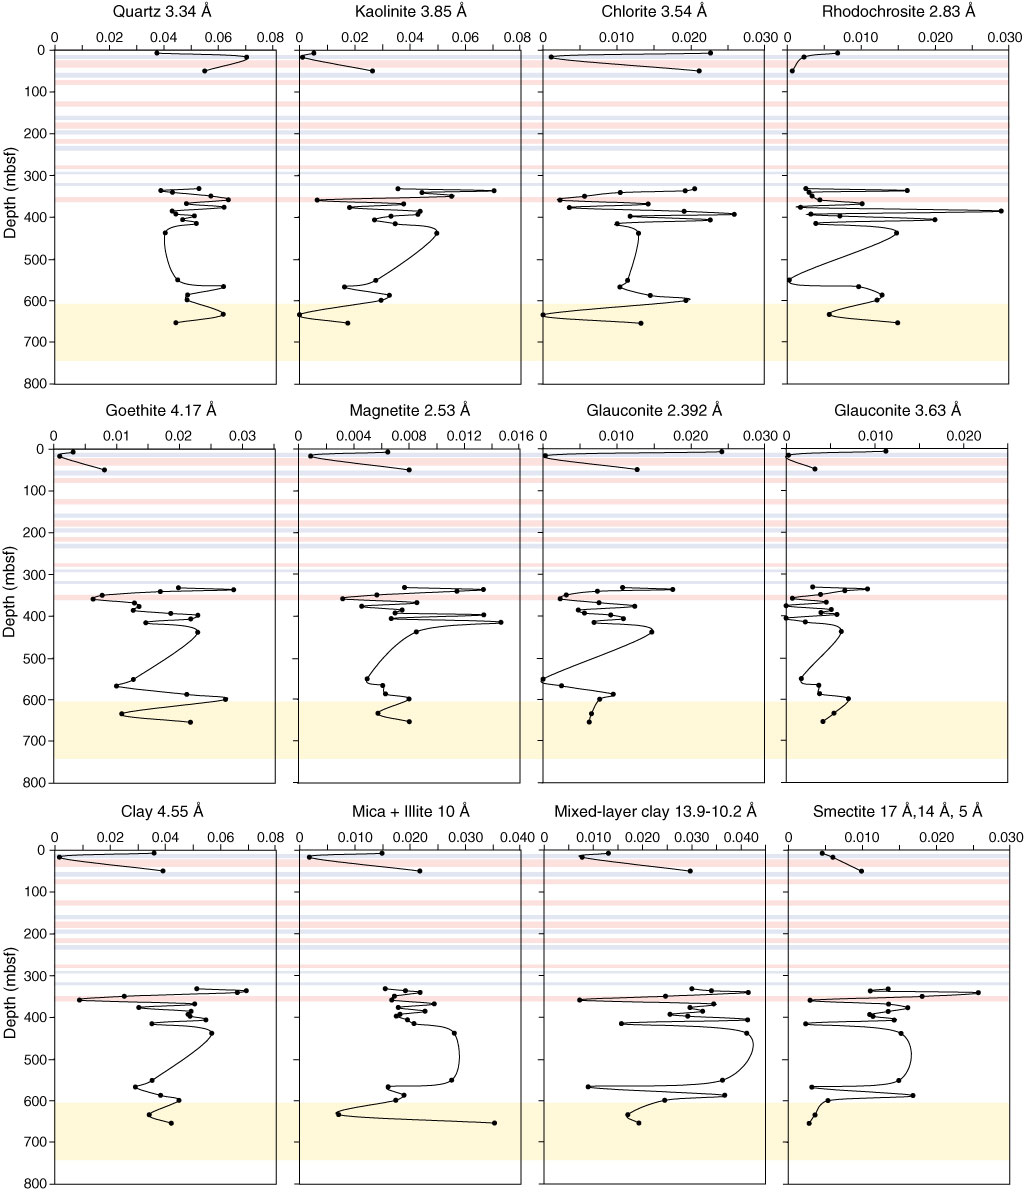
Figure F29. Composition-depth profiles of mineral content in sediment, Hole M0029A, as the ratio of intensity of the specified XRD peak(s) to total intensity of all peaks. Horizontal color bands denote discrete freshwater (blue), salty (pink), and briny (yellow) layers of interstitial water.
Previous | Close | Next | Top of page