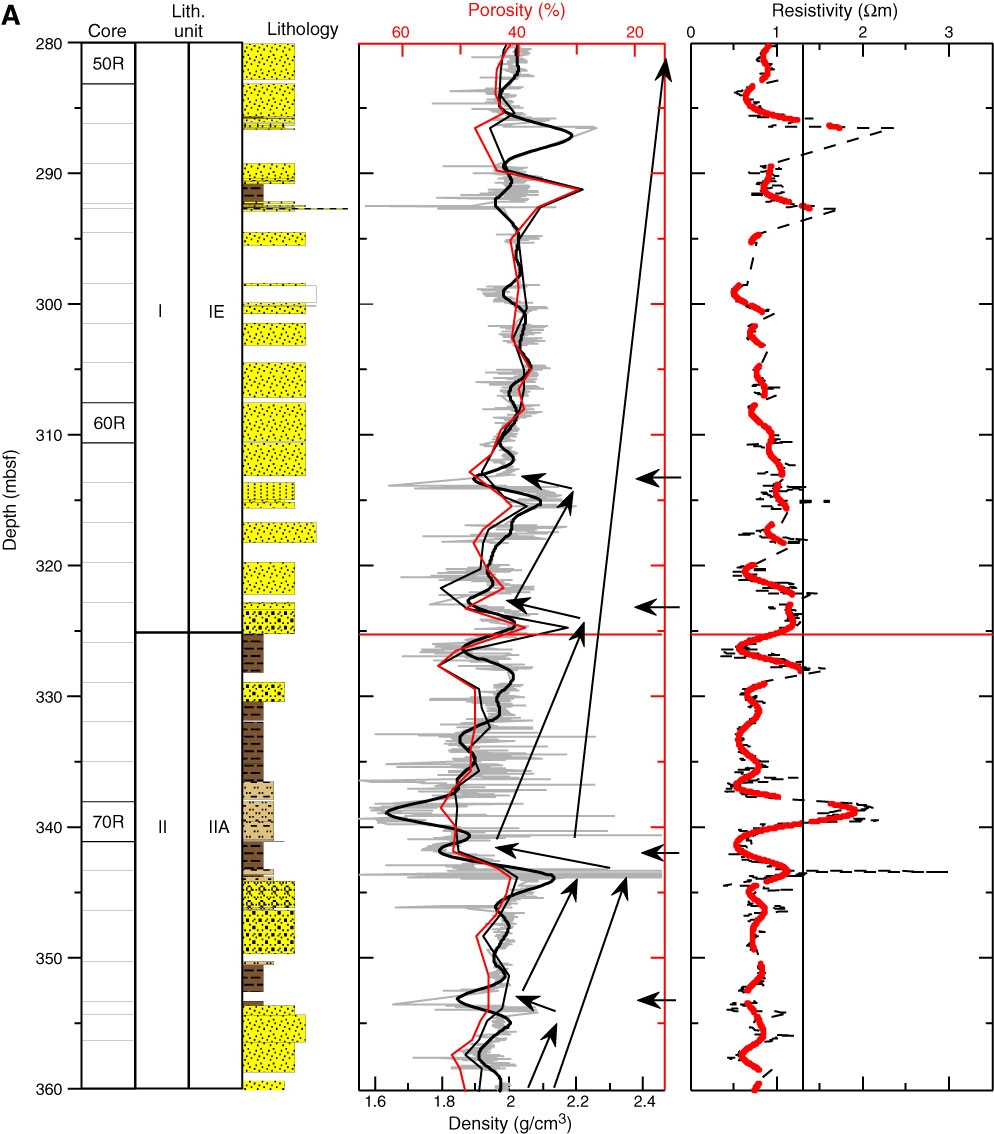
Figure F34. High-pass filtered density and porosity compared with lithology, Hole M0029A. Bulk wet density from samples (black line) overlain on filtered gamma density (thin black line) and original gamma density (gray). Note porosity (red line) increases to left. Overall packages with increasing density and decreasing porosity (diagonal arrows) have a tendency to end with a sharp decrease in density and increase in porosity (horizontal arrow). These sharp shifts to the left correspond to grain size decreases as determined from lithology and may represent flooding surfaces and/or sequence boundaries. Horizontal red lines = lithologic boundaries. See Figure F4 in the "Methods" chapter for lithology legend. A. 280–360 mbsf. (Continued on next three pages.)
Previous | Close | Next | Top of page