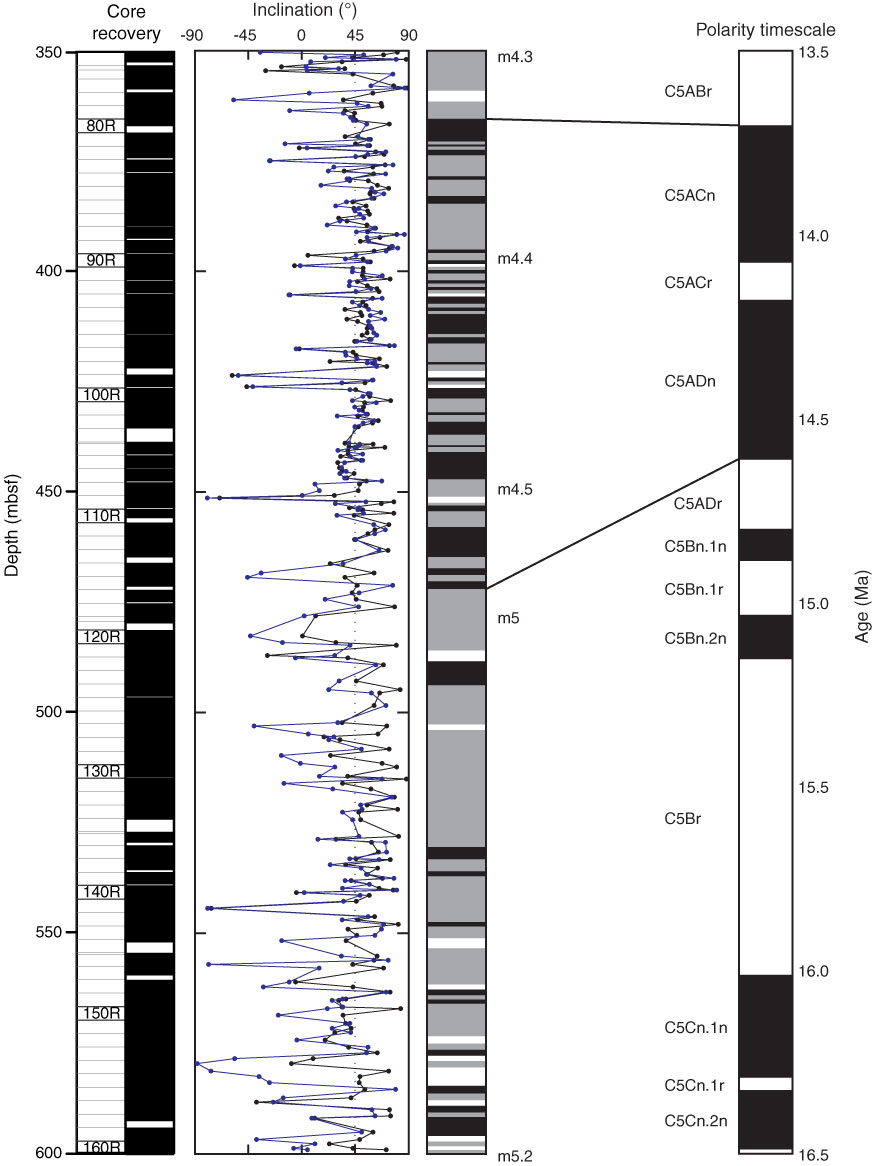
Figure F40. Preliminary magnetostratigraphic interpretation, Cores 313-M0029A-74R through 160R. Inclination data of initial NRM (black) and at 15 mT (blue). Magnetic polarity timescale from Cande and Kent (1995). Solid lines = tie points for tentative interpretations of reversal boundaries.

Previous | Close | Next | Top of page