Previous | Close | Next
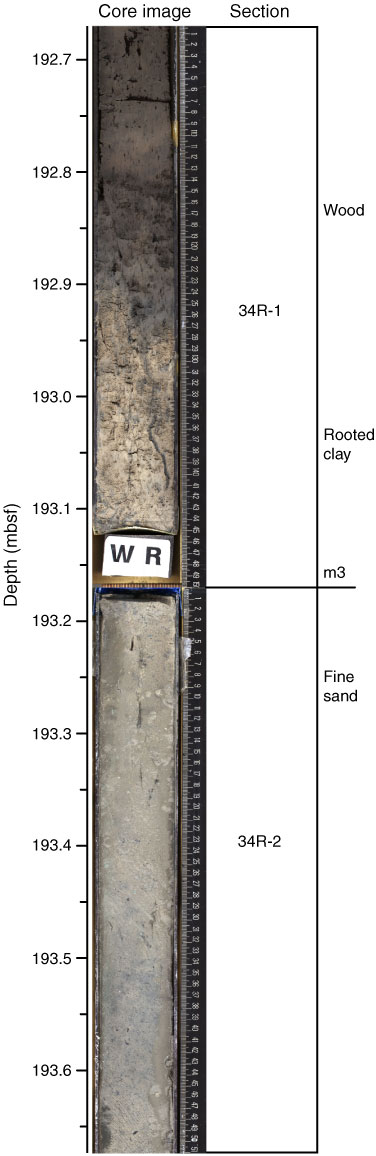
Figure F52. Correlation of core image with interpretation of deposition and age, 192.7–193.6 mbsf.
Previous | Close | Next | Top of page