Previous | Close | Next
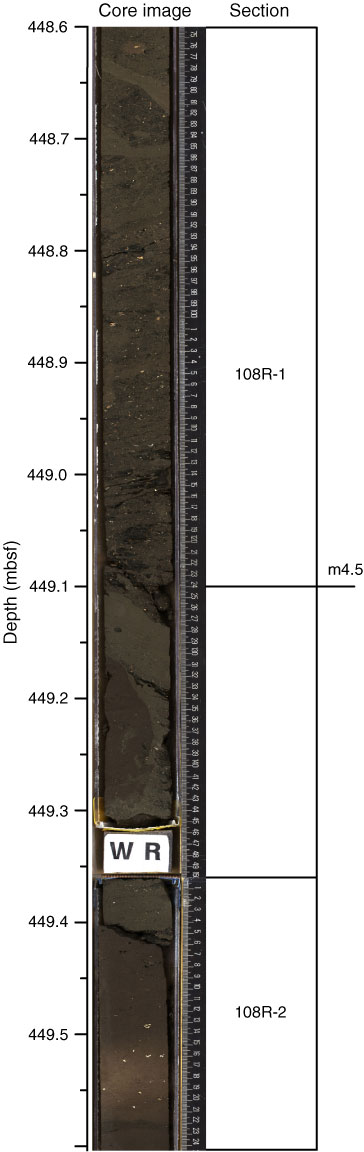
Figure F54. Correlation of core image with interpretation of deposition and age, 448.6–449.5 mbsf.
Previous | Close | Next | Top of page