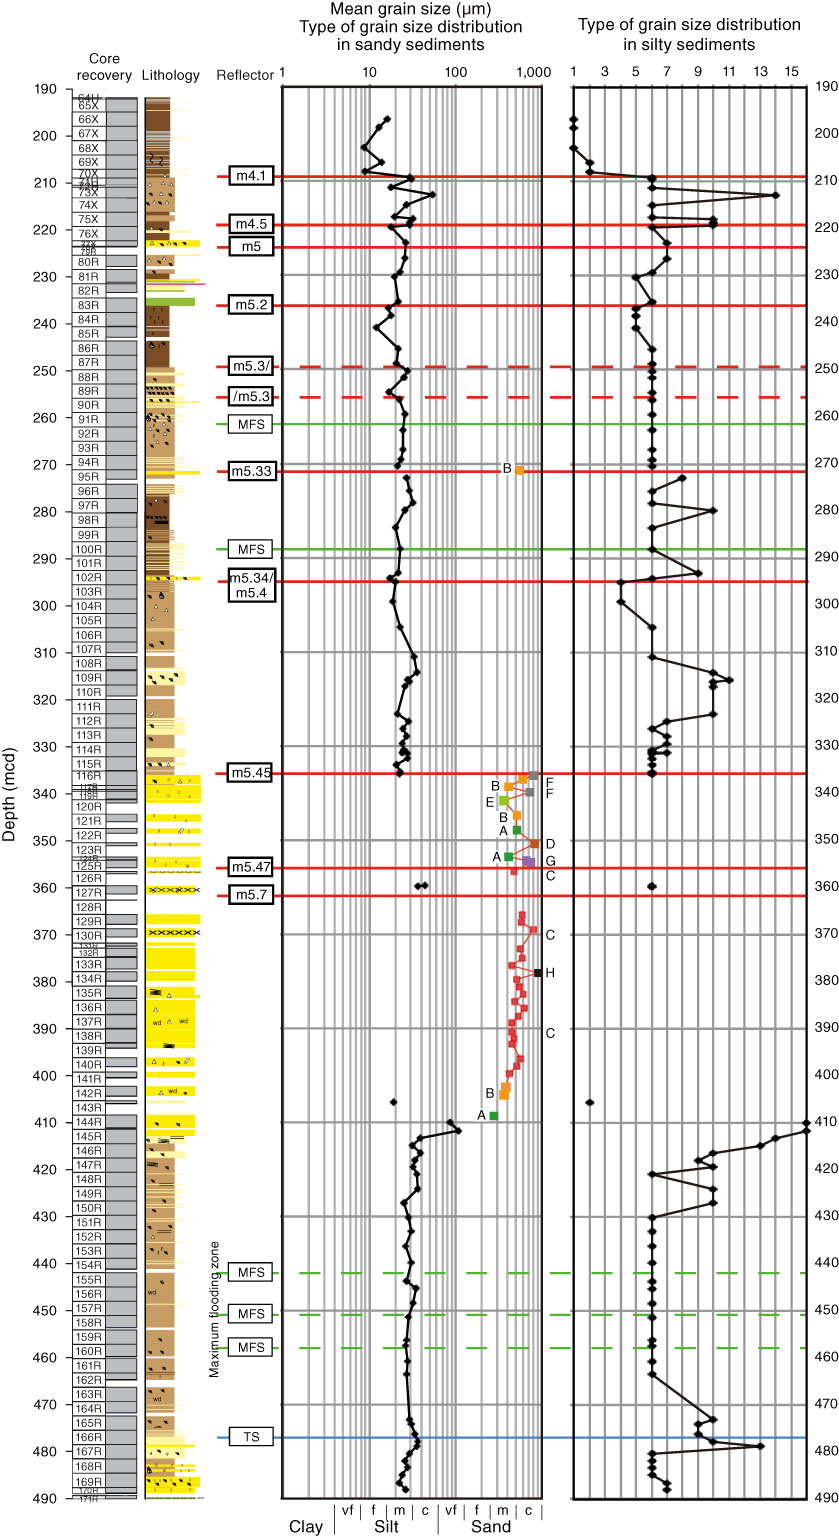
Figure F4. Stratigraphic trends of average grain-size variations and types of grain-size distribution, Site M0027. Core recovery and lithology column after Expedition 313 Scientists (2010b), reflector column after Miller et al. (2013a). Grain size columns: black diamonds and solid lines indicate silty sediment samples and measurements by laser scattering particle size distribution analyzer (LA-300), colored squares (green = Type A, orange = Type B, red = Type C, brown = Type D, light green = Type E, gray = Type F, purple = Type G, black = Type H) and thin red solid lines indicate sandy samples measured by particle analyzer with digital image processing (CAMSIZER). Types A–H shown in Figure F3; Types 1–16 (grain-size distribution in silty sediments) shown in Figure F2. m4.1–m5.7 = sequence boundaries, MFS = maximum flooding surface, TS = transgressive surface. vf = very fine, f = fine, m = medium, c = coarse.
Previous | Close | Next | Top of page