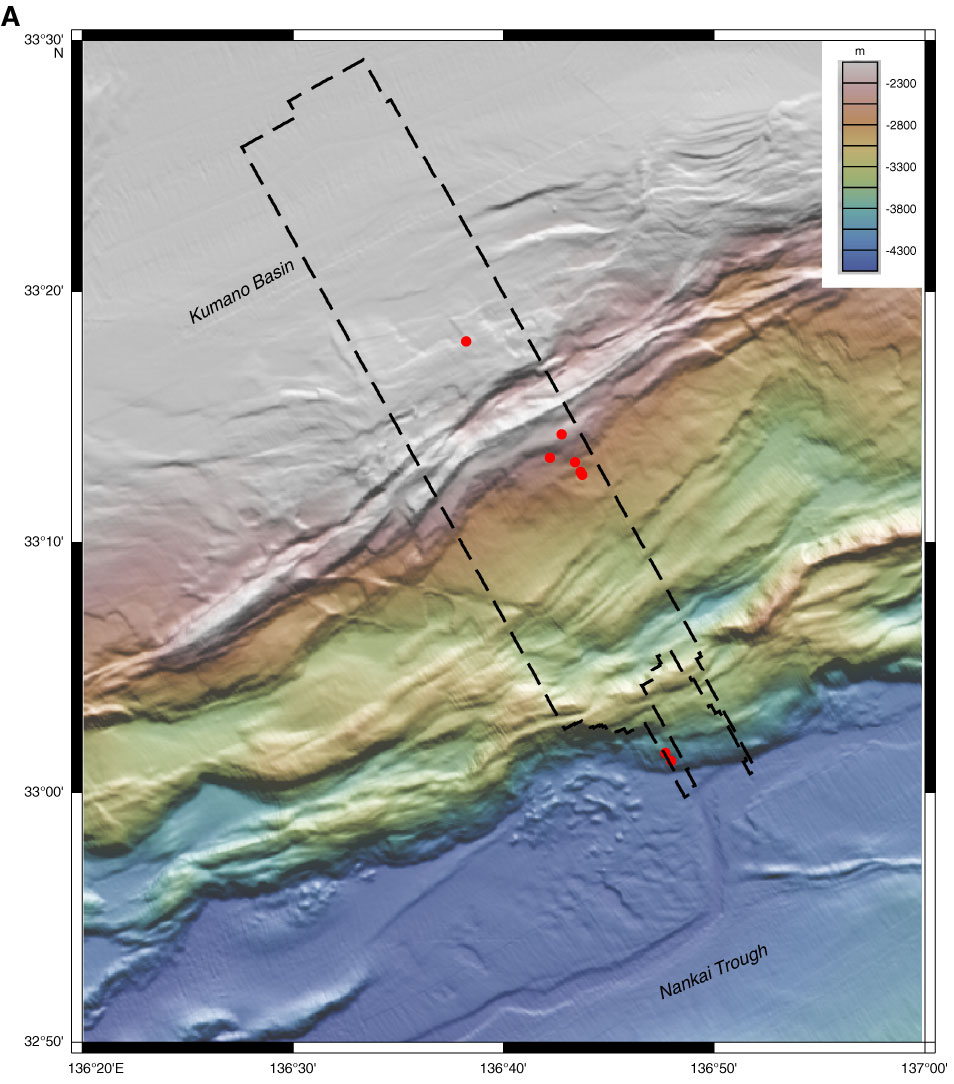
Figure F4. A. Multibeam bathymetry of the Kumano Basin region. Dashed line = 3-D seismic survey, circles = NanTroSEIZE Stage 1 drill sites. Details of bathymetry data acquisition and processing are summarized in Ike et al. (2008a). (Continued on next page.)
Previous | Close | Next | Top of page