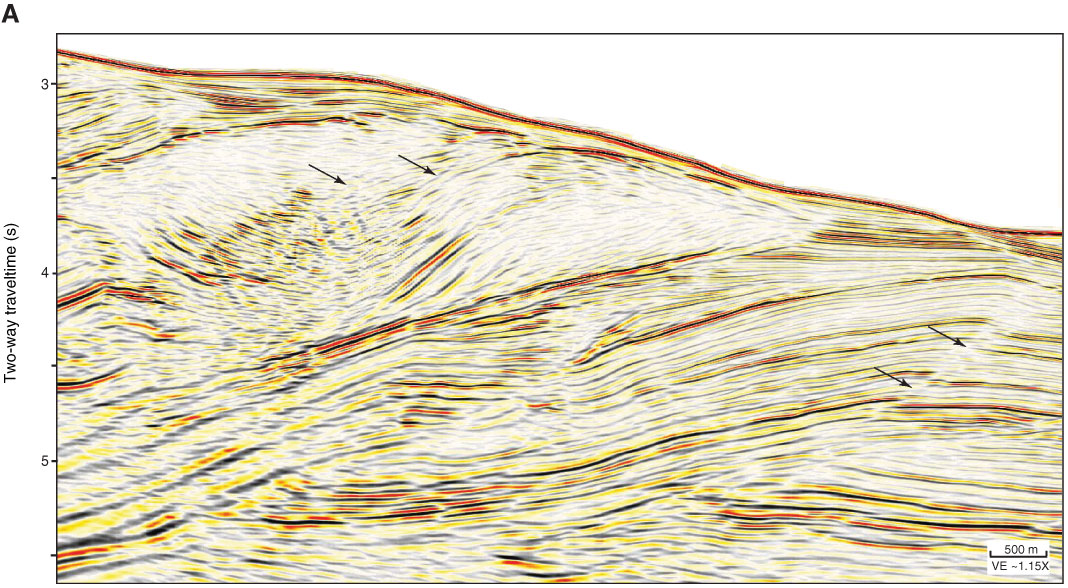
Figure F5. Three-dimensional seismic Inline 2675 showing comparison between (A) PSTM and (B) PSDM. PSDM converted from depth to time using PSDM velocities for easier comparison to PSTM image. Arrows = specific examples of reflections that are clarified in the depth migration. (Continued on next page.)

Previous | Close | Next | Top of page