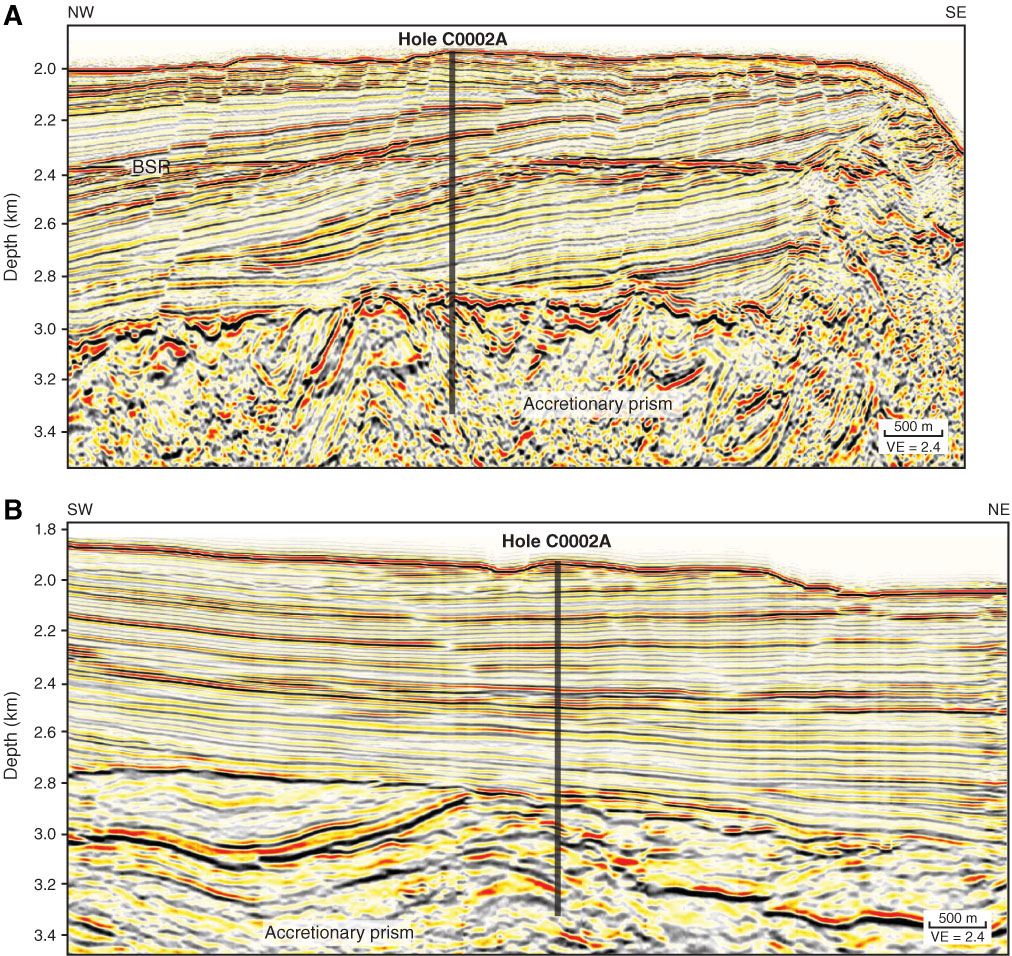
Figure F12. Three-dimensional seismic profile crossing Site C0002 (Moore et al., 2007). Profile locations plotted in Figures F2 and F13. A. Inline 2529. B. Cross-line 6225. BSR = bottom-simulating reflector, VE = vertical exaggeration.
Previous | Close | Next | Top of page