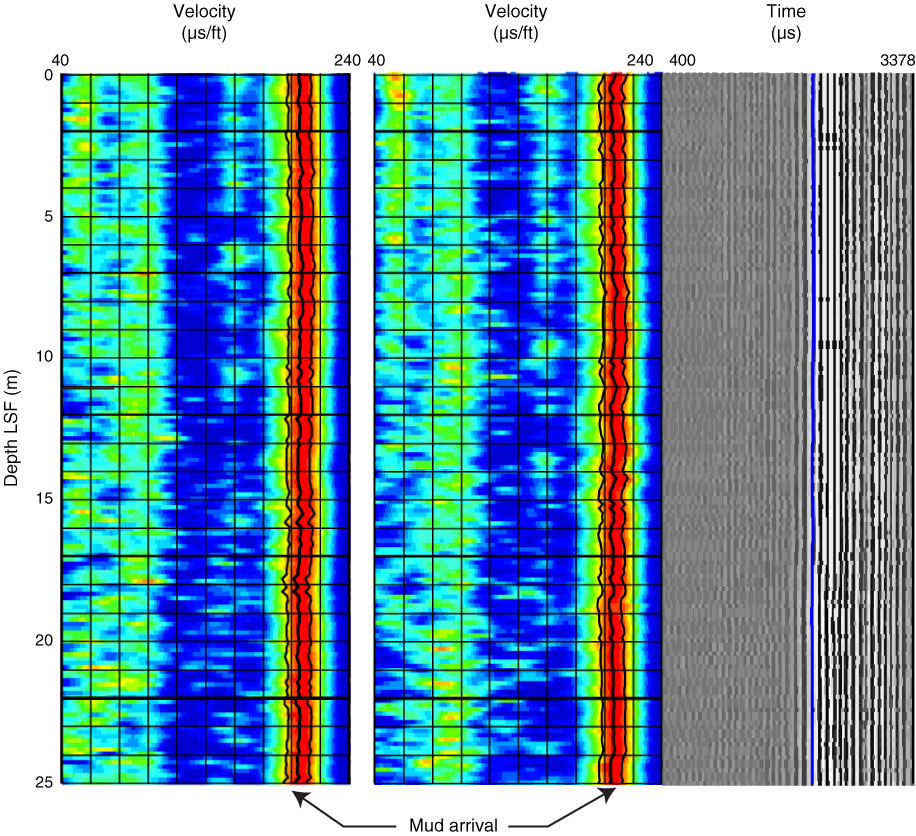
Figure F18. sonic VISION tool sonic log quality control plot from 0 to 25 m LWD depth below seafloor (LSF). Color panels = slowness coherence plots for the common source and common receiver configurations of the tool. Horizontal axis = slowness, with higher slowness (lower velocity) to the right. Warm colors = high signal strength at a particular slowness. Black lines = manual picks made by Schlumberger Data Consulting Services specialist. Gray-scale plot shows seismograms with time increasing to the right. Blue line = arrival pick associated with slowness identified in picks on left. Final slowness value at a depth is given by the mean of the slownesses picked in the common source and common receiver configurations. This serves to compensate for tool position in the hole.
Previous | Close | Next | Top of page