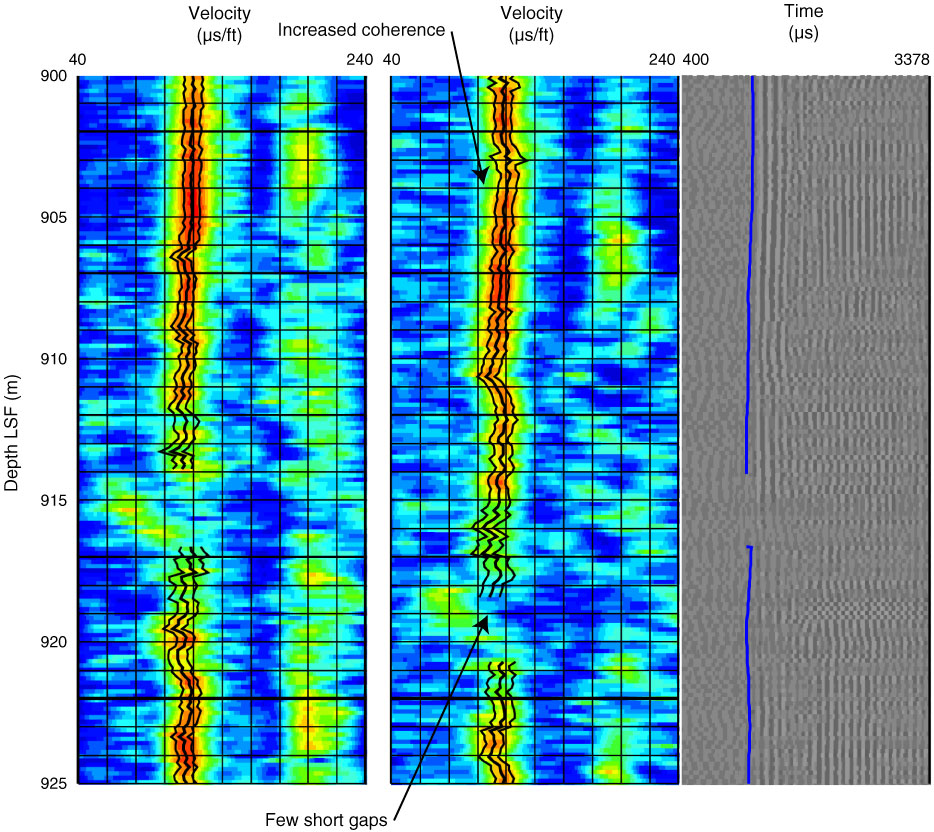
Figure F23. Sonic log quality control plot from 900–925 m LWD depth below seafloor (LSF). Color panels are slowness coherence plots for the common source and common receiver configurations of the tool. Horizontal axis is slowness, with higher slowness (lower velocity) to the right. Warm colors = high signal strength at a particular slowness. Black lines are manual picks made by Schlumberger Data Consulting Services specialist. Gray-scale plot shows seismograms with time increasing to the right. Blue line = arrival pick associated with slowness identified in picks on left. Final slowness value at a depth is given by the mean of the slownesses picked in the common source and common receiver configurations. This serves to compensate for tool position in the hole.
Previous | Close | Next | Top of page