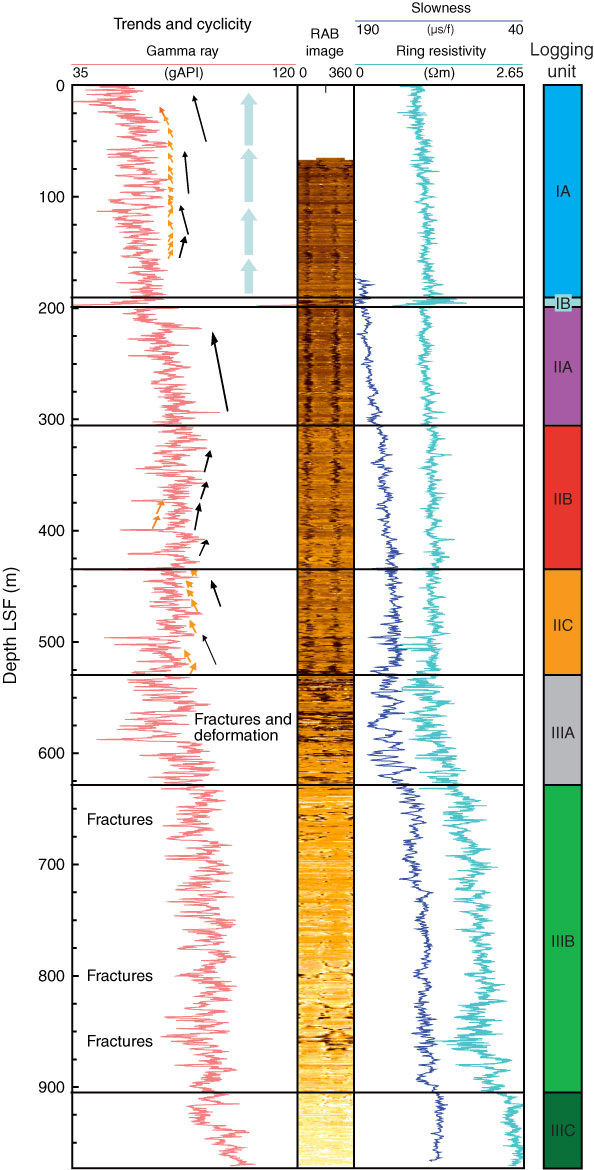
Figure F28. Trends and cyclicity in the gamma ray log and resistivity at bit (RAB) image (shallow, static) for the full section. LSF = LWD depth below seafloor. Orange arrows = meter-scale trends, black arrows = decametric trends, blue arrows = four decametric cycles in logging Subunit IA.
Previous | Close | Next | Top of page