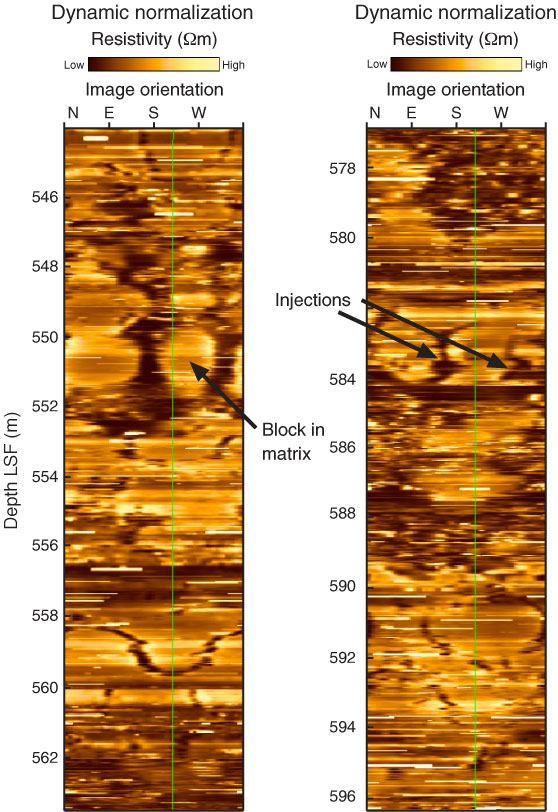
Figure F43. Images of disrupted zone at 543–565 and 577–599 m LWD depth below seafloor (LSF), showing range of disruption, including “block in matrix” texture (550–551 m LSF) and possible injection of more conductive sediment into more resistive sediment.
Previous | Close | Next | Top of page