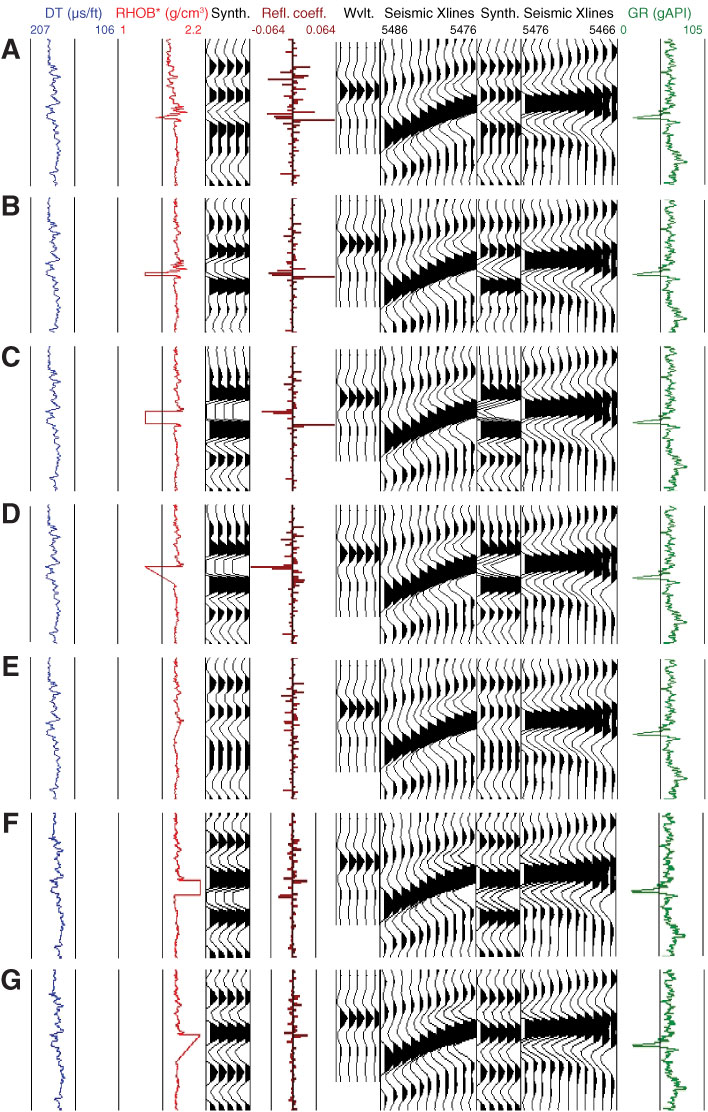
Figure F54. The 200 m layer with synthetic seismogram results that accompany changing the density values within the 5–8 m thick zone. Bulk density values (RHOB*) include measured, calculated, and modeled values. A. Favored merged density curve. B. Pseudodensity curve with a 1.5 m thick zone with 1.4 g/cm3 density. C. Pseudodensity curve with a 5.5 m thick zone with 1.4 g/cm3 density. D. Same zone as in C but with a sloping base. E. Pseudodensity curve with no zone. F. Pseudodensity curve with a 5.5 m thick zone with 2.1 g/cm3 density. G. 2.1 g/cm3 density boundary at the top of the zone that slopes back to measured densities over ~16 m. DT = slowness, Synth. = synthetic, Refl. coeff. = reflection coefficient, Wvlt. = source wavelet, GR = gamma ray value.
Previous | Close | Top of page