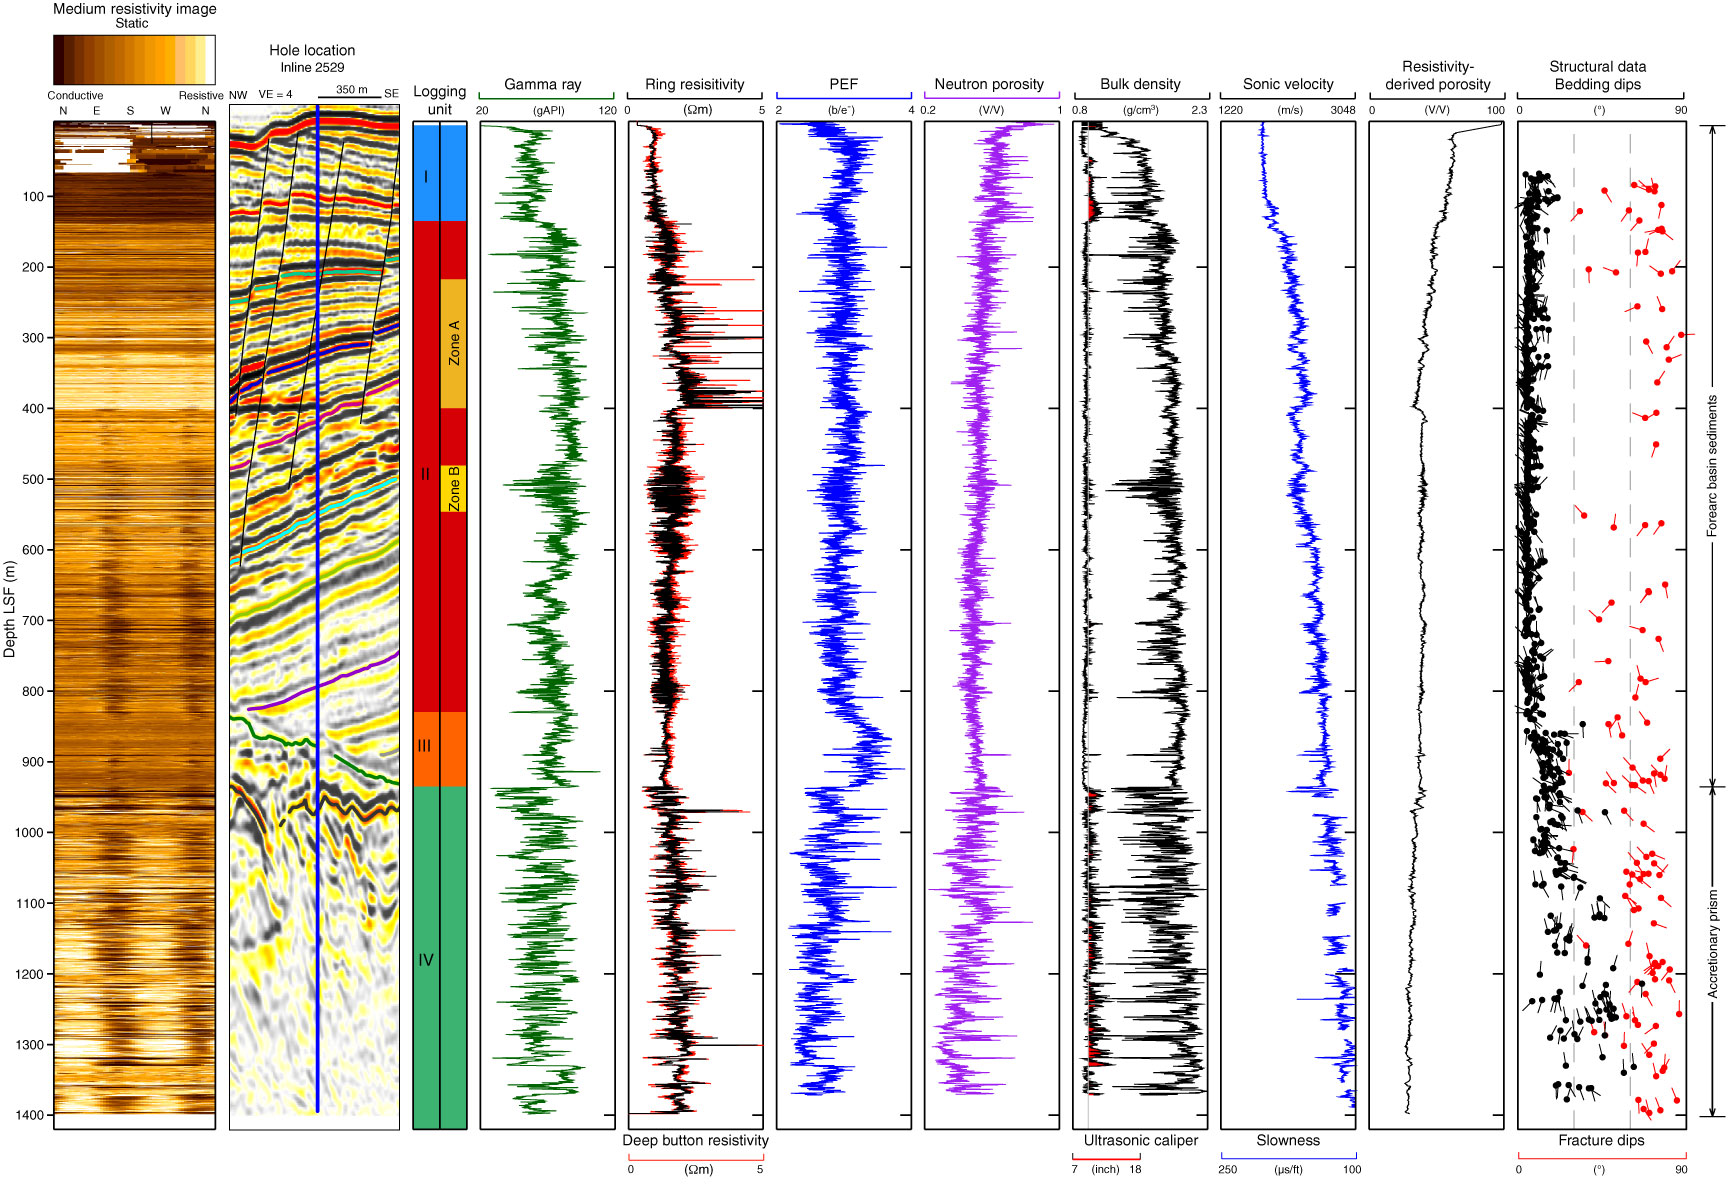
Figure F1. Summary log diagram, Site C0002. Bedding and fracture dips from resistivity at bit image. LSF = LWD depth below seafloor, VE = vertical exaggeration, PEF = photoelectric factor. Black tadpoles = bedding, red tadpoles = fracture, tadpole line = dip direction of plane.
Close | Next | Top of page