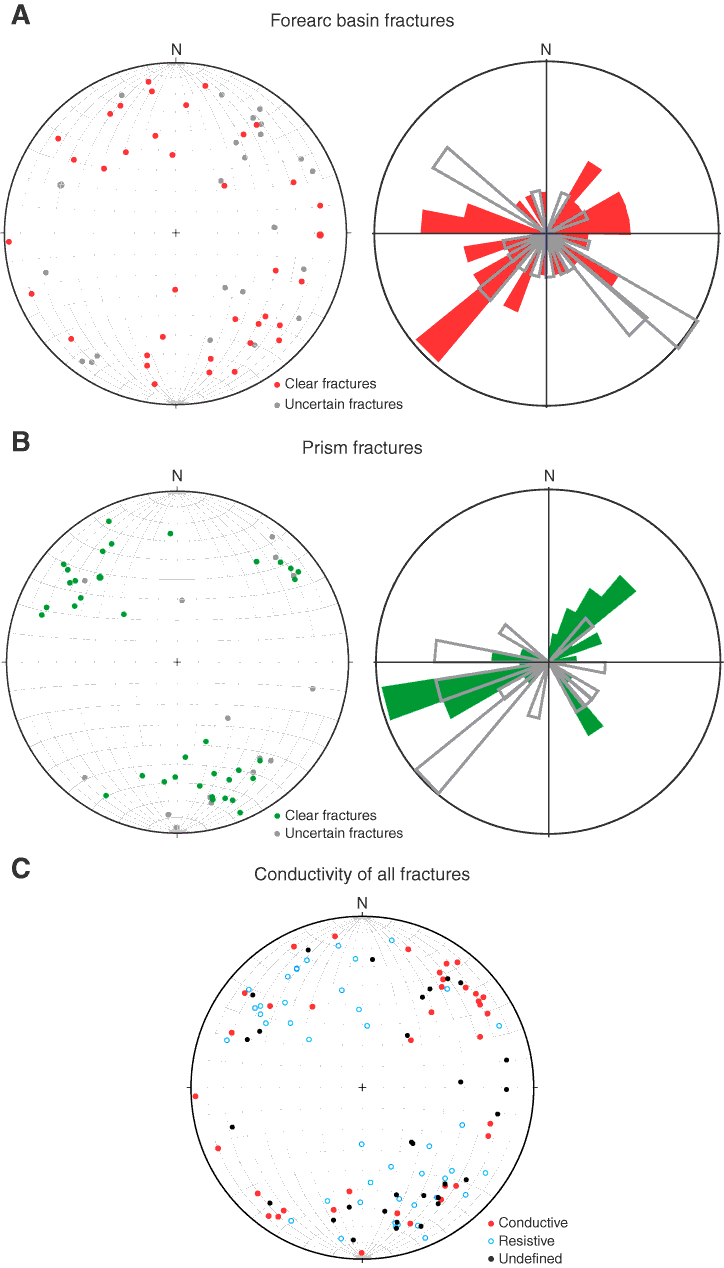
Figure F32. Equal area lower hemisphere stereographic projection of poles to fracture planes for (A) forearc basin, (B) prism, and (C) all fractures differentiated according to conductivity. Rose diagrams represent fracture azimuths (shown as dip direction –90°), preserving dip direction information.

Previous | Close | Next | Top of page