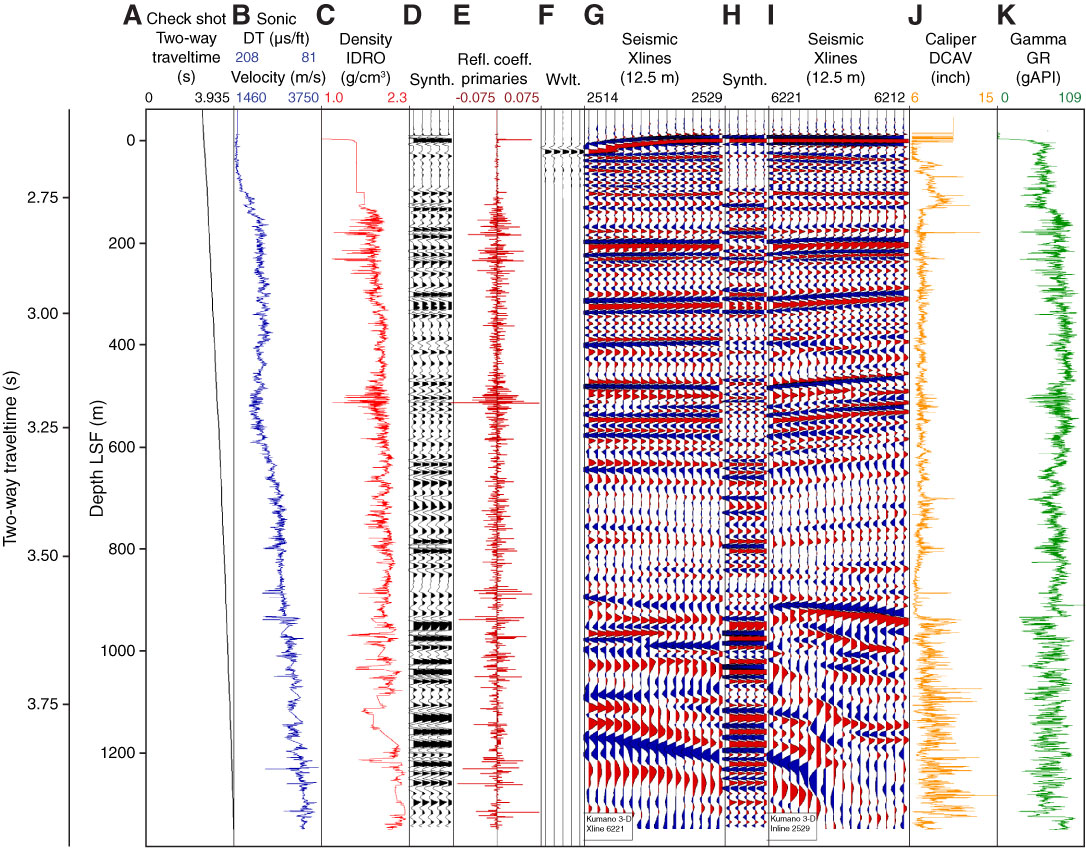
Figure F52. Synthetic seismogram test for Site C0002. Note correspondence of high caliper values, low gamma ray values suggestive of sand layers, and erroneous reflectors in the synthetic. A. Time vs. depth curve based on check shot. TWT = two-way traveltime. B. Sonic log (see text for description of interpolation). C. Image-derived density (IDRO) log (see text for description of filtering and interpolation). D. Computed synthetic (Synth.) seismogram shown as five identical traces side by side. E. Reflection coefficients (Refl. coeff.) determined from the input sonic and density logs. F. 256 ms deterministic wavelet (Wvlt.) used for the source wavelet. G. Fifteen traces of cross-line 6221 closest to borehole. H. Synthetic seismogram repeated with positive amplitude filled in red and negative amplitude filled in blue. I. Fifteen traces of Inline 2529 closest to borehole. J. Ultrasonic caliper (DCAV). K. Gamma ray (GR) log. LSF = LWD depth below seafloor.

Previous | Close | Top of page