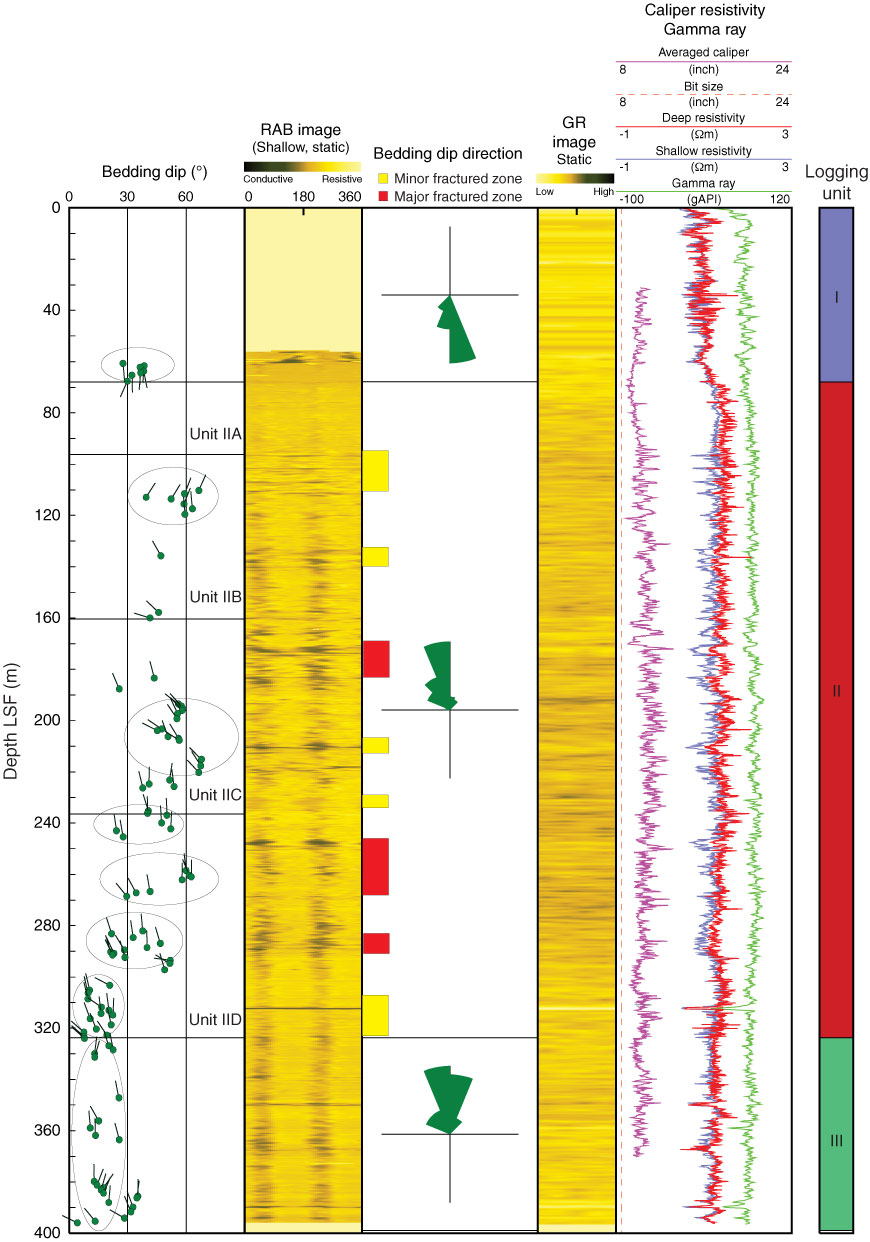
Figure F12. Summary plot of bedding dips derived from image data. Circled tadpole groups described in text. Rose diagrams = dominant bedding dip direction. LSF = LWD depth below seafloor, RAB = resistivity-at-the-bit, GR = gamma ray.
Previous | Close | Next | Top of page