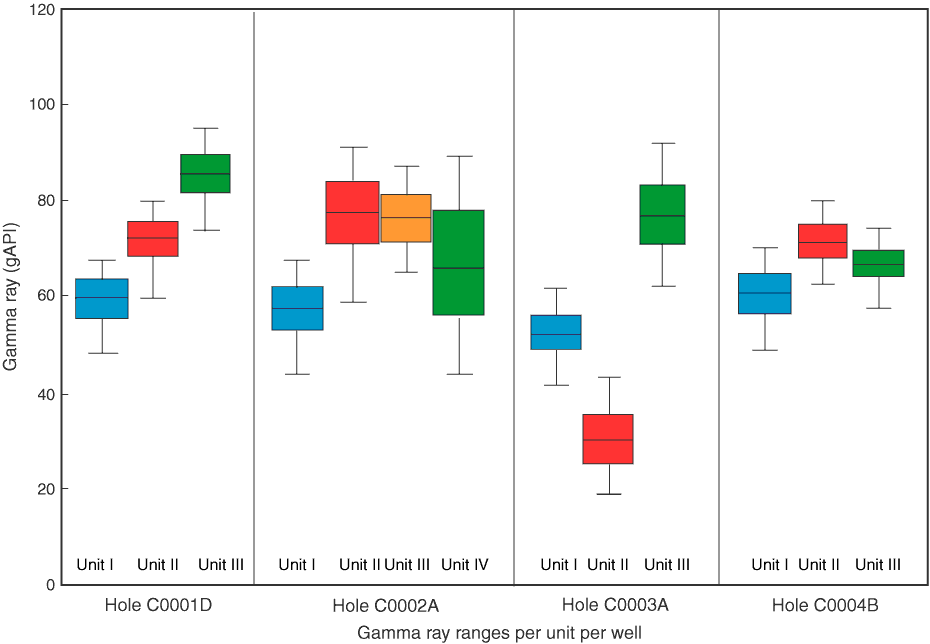
Figure F17. Statistical distribution of gamma ray values for the logging units at each site. Box outline = 25th to 75th percentile, separated by the mean. All units shown in the figure are logging units. Logging Unit I in Holes C0001D and C0004B have a very similar range, as does logging Unit II from those two sites.

Previous | Close | Next | Top of page