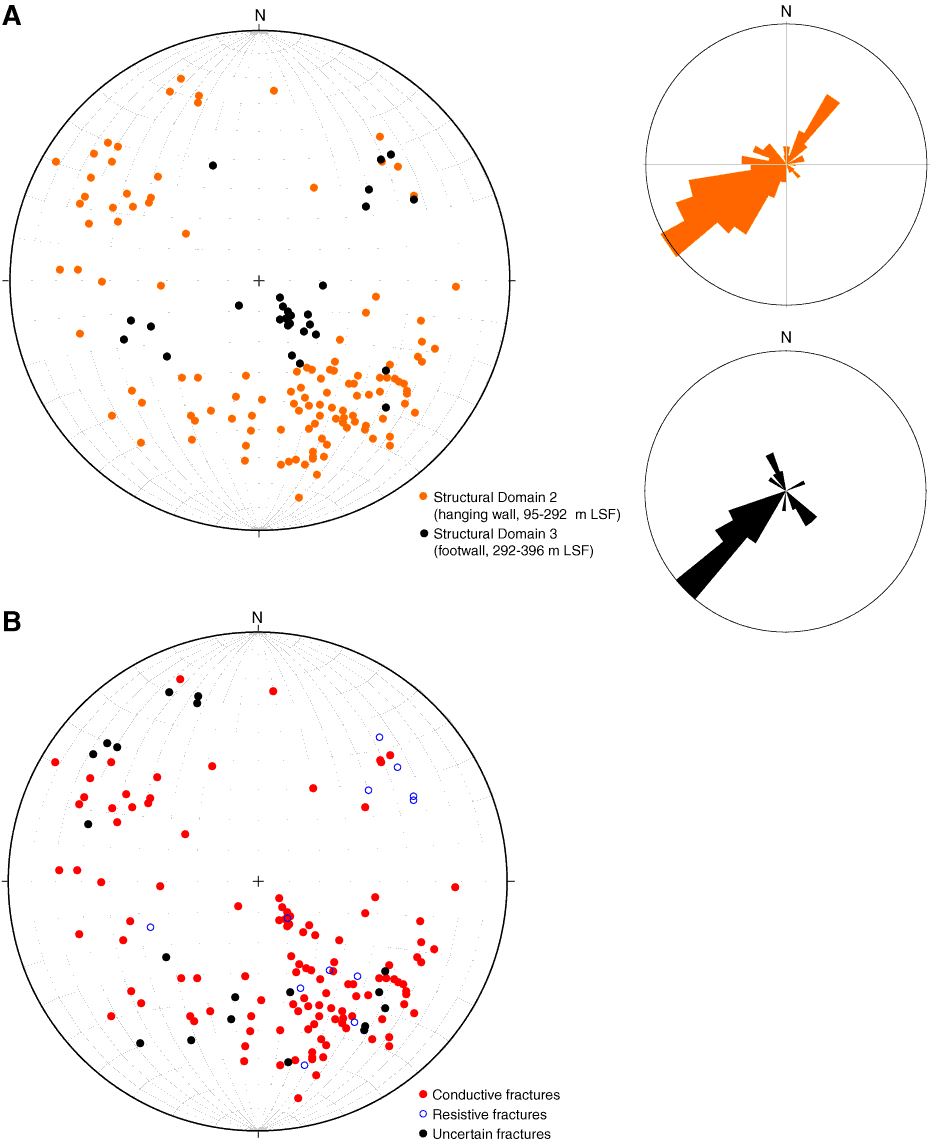
Figure F27. Equal area lower hemisphere stereographic projections of poles to fracture planes (left). A. Fractures divided into structural Domains 2 and 3 (no natural fractures were identified in structural Domain 1). Rose diagrams (right) represent fracture azimuths (shown as dip direction –90°), preserving dip direction information. B. Poles of all fractures within the borehole differentiated according to conductivity.

Previous | Close | Next | Top of page