Previous | Close | Next
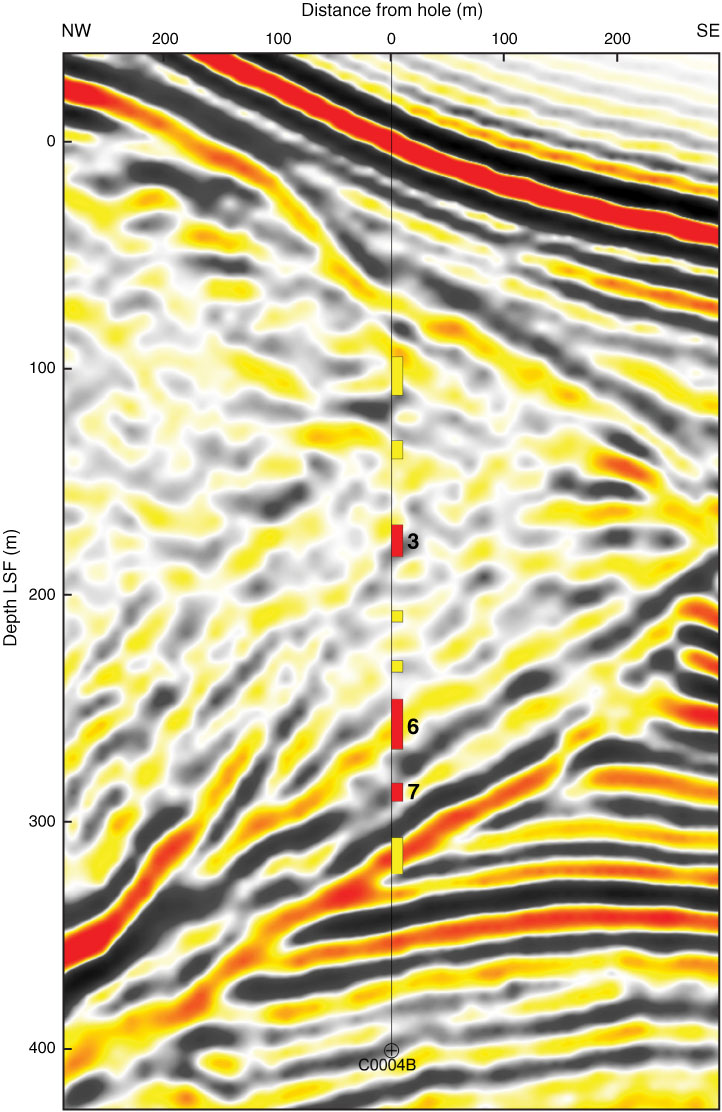
Figure F33. Correlation of fractured zones and seismic profile. Red = major fractured zones, yellow = minor fractured zones. LSF = LWD depth below seafloor.
Previous | Close | Next | Top of page