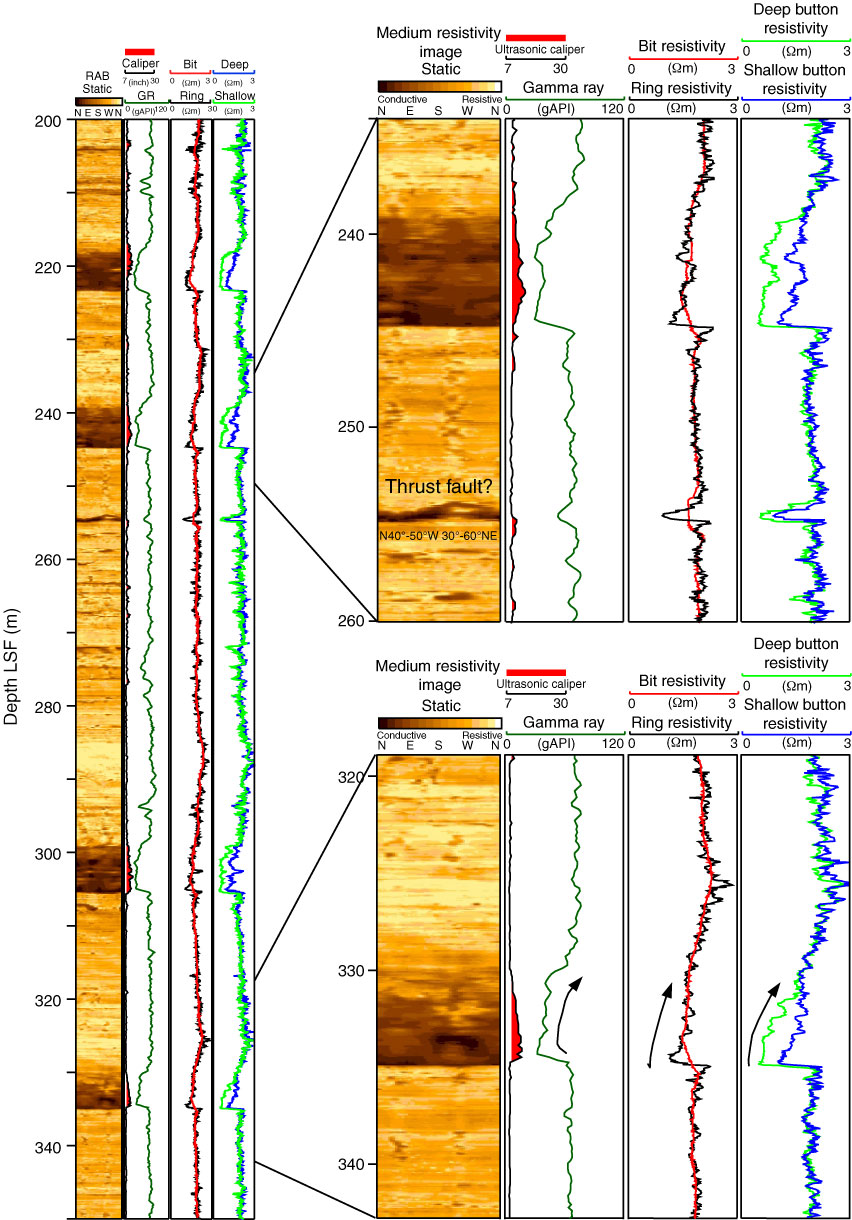
Figure F15. Logging Unit II logs. Upward-fining sequences in four sand layers are clearly imaged by resistivity-at-the-bit (RAB) images and exhibited by gamma ray (GR) and resistivity log curves. An inferred thrust fault at 254 m LWD depth below seafloor (LSF) is shown.

Previous | Close | Next | Top of page