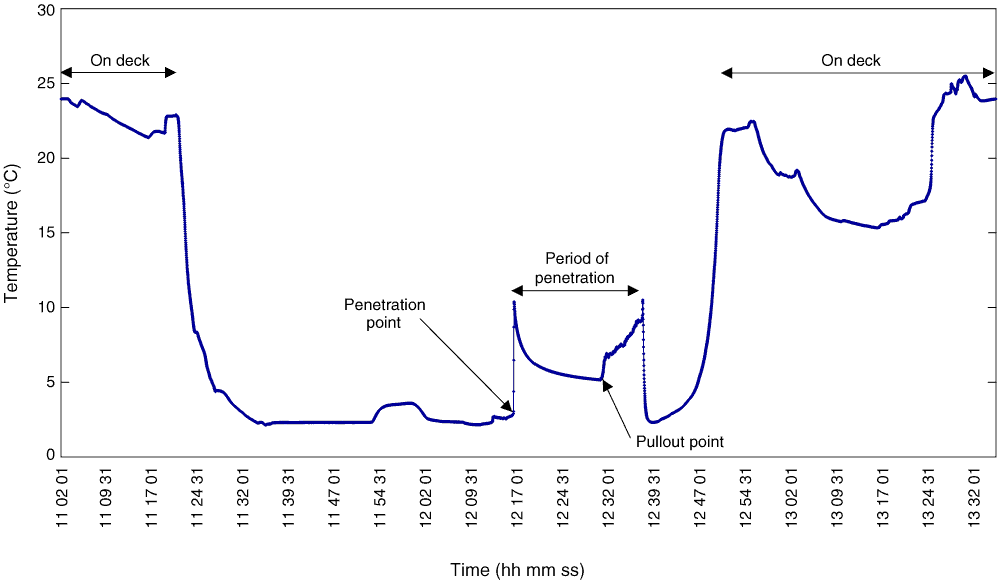
Figure F21. Typical penetration curve consisting of three parts: initial rise of temperature because of frictional heating, decay curve as sensor equilibrates to in situ temperature of sediment, and another rise while tool is pulled out.

Previous | Close | Next | Top of page