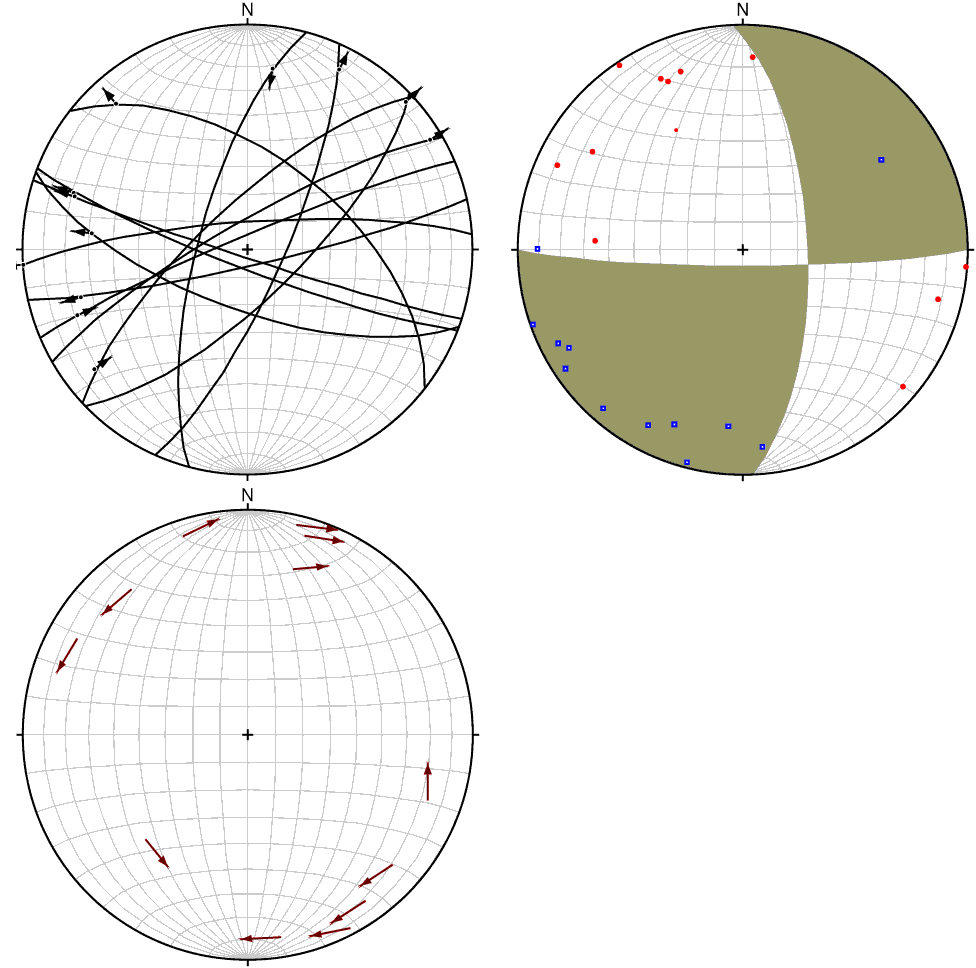
Figure F21. Lower hemisphere, equal area projections of steeply dipping (?50°) strike-slip faults below the deformed zone and their kinematic solutions. A. Fault planes (great circles) with striae (dots) and slip vectors (arrows) of the hanging walls relative to the footwalls. Black dots and arrows = data with slickenlines, red dots and arrows = slip directions assumed in the dip directions and slip vectors inferred from offset. B. Kinematic solution for the populations of strike-slip faults shown in A with P (compression, red) and T (extension, blue) axes for each fault and compressional (transparent) and associated extensional (gray shaded) quadrants. C. Tangent lineations. Arrows = movement direction of footwall with respect to hanging wall.
Previous | Close | Next | Top of page