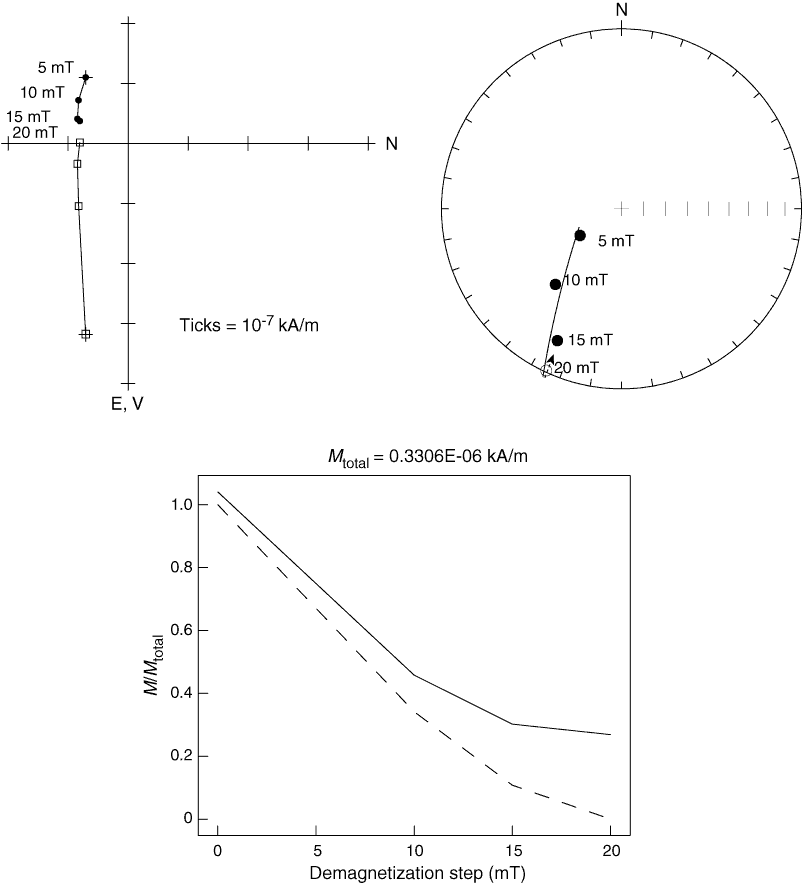
Figure F33. Progressive AF demagnetization displayed by vector end-point diagram (Zijderveld, 1967), lower hemisphere equal area projection, and normalized change in the intensity (Sample 315-C0001H-24R-1, 80–82 cm). Data points = magnetization vector for individual demagnetization steps projected onto horizontal (dots) and vertical (squares) plane. Dashed line = decay curve of vector difference sum. Note that characteristic magnetization direction is not yet defined at a maximum field of 20 mT. Demagnetization trend on stereonet projection shows a great circle with an approximately north-northeast–south-southwest orientation, dipping to the west-northwest. Progression of end vectors suggests a higher coercivity component with negative inclination.

Previous | Close | Next | Top of page