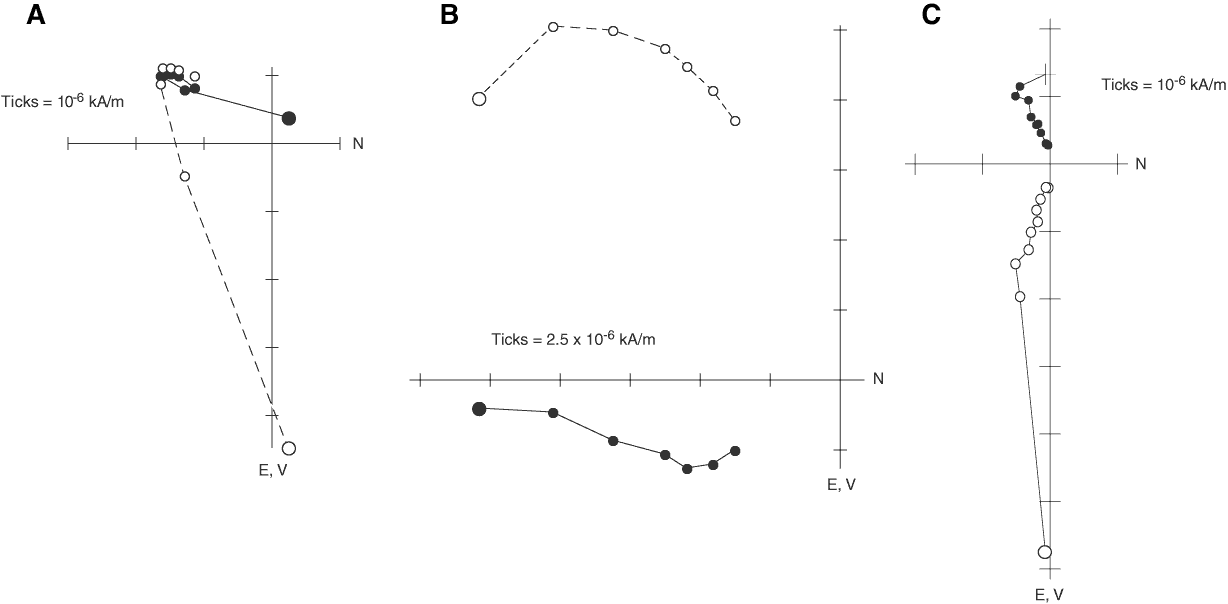
Figure F16. Results of progressive alternating-field demagnetization displayed by vector end-point diagram (Zijderveld, 1967) of representative samples. A. Sample 315-C0002B-20R-5, 15 cm. Demagnetization steps = 0, 5, 10, 15, 20, 25, and 30 mT. B. Sample 315-C0002B-27R-1, 55 cm. Demagnetization steps = 0, 5, 10, 15, 20, 25, and 30 mT. C. Sample 315-C0002D-2H-2, 5–7 cm. Demagnetization steps = 0, 5, 10, 15, 20, 25, 30, 40, 50, and 60 mT. Data points = magnetization vector for individual demagnetization steps projected onto horizontal (solid circle) and vertical (open circle) plane.

Previous | Close | Next | Top of page