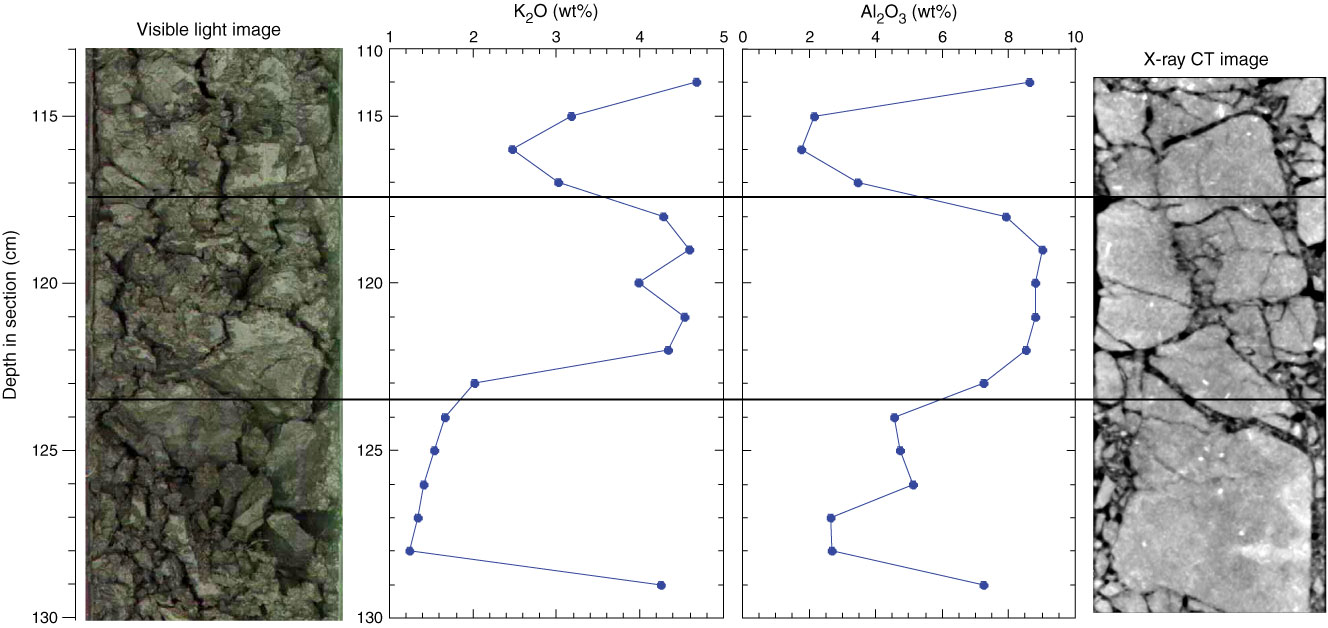
Figure F12. Comparison of XRF elemental analysis to core photograph and X-ray computed tomography (CT) image of CT-defined lithology Type 1. Elemental variations revealed by the XRF signal, most likely corresponding to variations in silt/clay ratio, are not reflected in either imaging mode (interval 316-C0004D-30R-1, 114–129 cm). Oxide weight percent by XRF scan.
Previous | Close | Next | Top of page