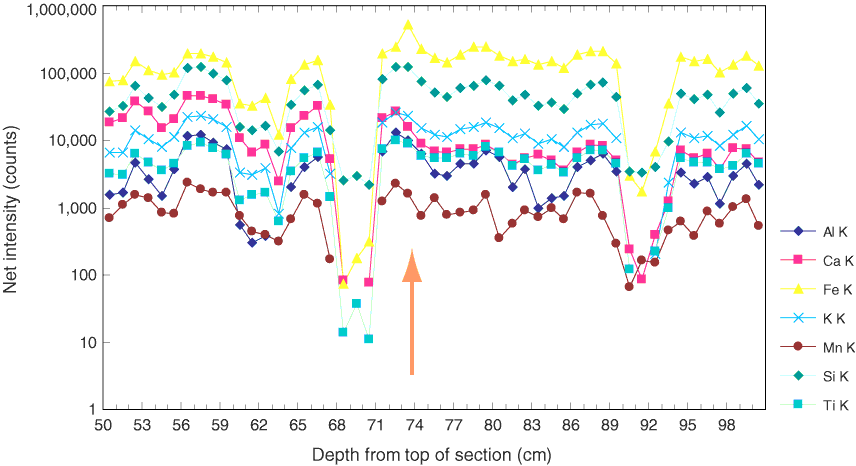
Figure F9. X-ray total intensities along first scan across the unconformity (Section 316-C0004C-9H-5). Orange arrow = approximate position of the unconformity. Intervals of low intensity arise from sample surface topography that either blocked excitation X-rays from striking the sample or prevented generated X-rays from entering the detector.

Previous | Close | Next | Top of page