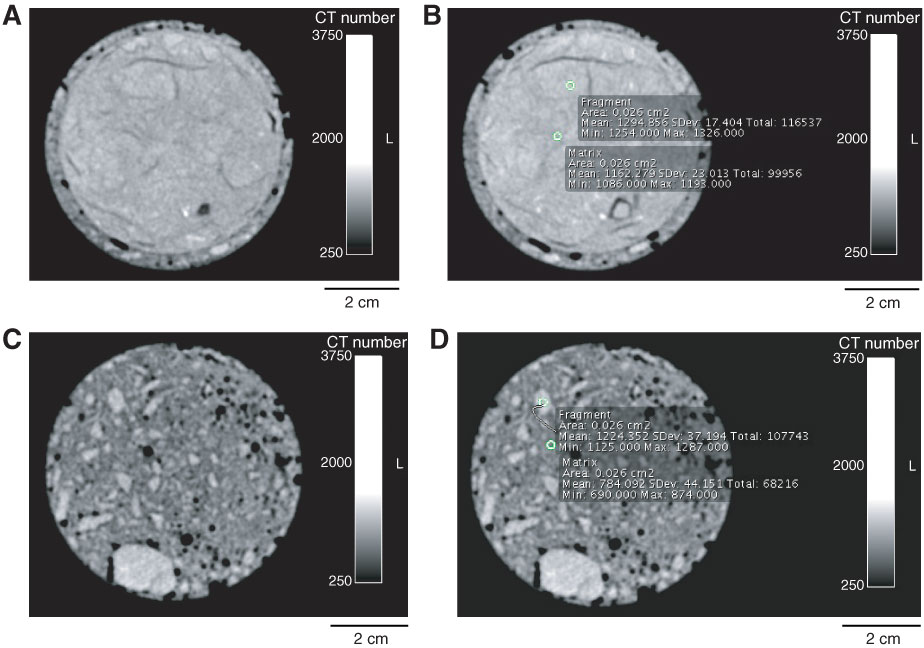
Figure F25. Representative appearance of fault breccia and drilling-induced breccia in computed tomography (CT) images. A. Slice of fault breccia cut perpendicular to core axis (interval 316-C0004D-28R-2, 45.13 cm). B. Same as A with CT numbers of matrix and fragment. Note the small contrast in CT number between matrix and fragment (1162 versus 1294). C. Slice of drilling-induced breccia cut perpendicular to core axis (interval 316-C0004D-28R-2, 49.75 cm). D. Same as C with CT numbers of matrix and fragment. Note the large contrast in CT numbers between matrix and fragment (784 vs. 1224).
Previous | Close | Next | Top of page