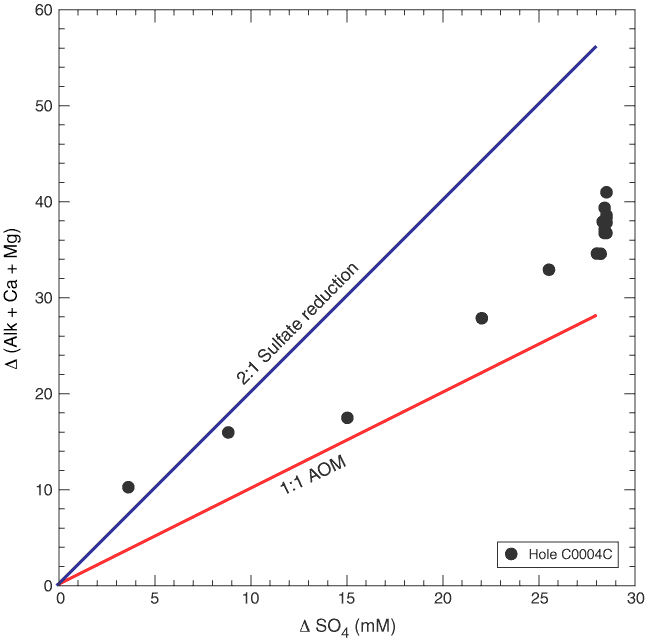
Figure F44. Change in alkalinity (corrected for authigenic carbonate precipitation) vs. change in sulfate in uppermost 50 m of Unit I, Site C0004. Blue line = expected values for microbially mediated sulfate reduction-organic matter degradation, red line = expected values for anaerobic oxidation of methane (AOM).

Previous | Close | Next | Top of page