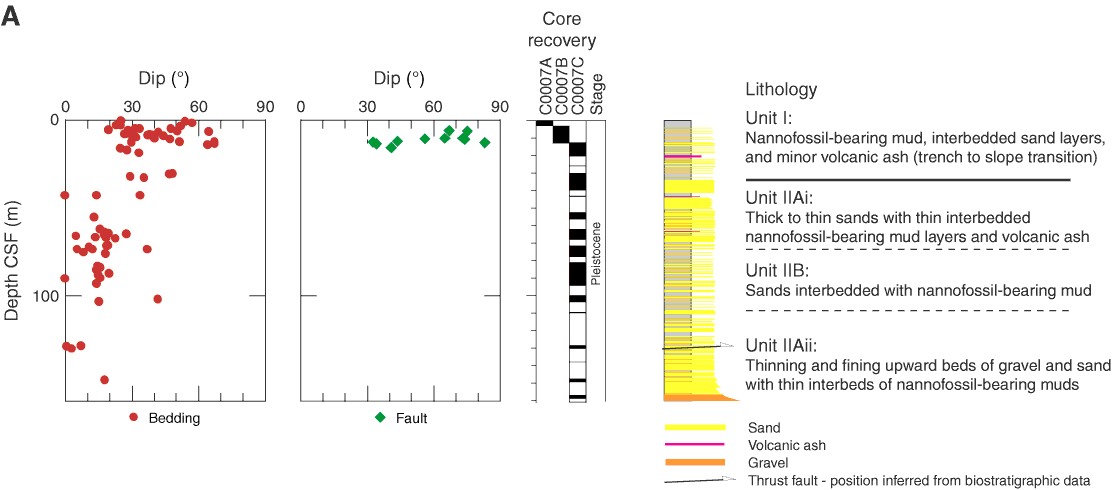
Figure F16. Distribution of planar structures with depth. Lithologic divisions and core recovery with depth are shown at right. A. Holes C0007A, C0007B, and C0007C. Note that deformation bands are concentrated between 230 and 248 m core depth below seafloor (CSF) but most of their orientations cannot be measured because of poor core quality (e.g., drilling-induced brecciation). Shaded bands = three fault zones recognized in the prism. Blacks lines in shaded bands = zones of concentrated deformation in fault zones (see text for further explanation). (Continued on next page.)
Previous | Close | Next | Top of page