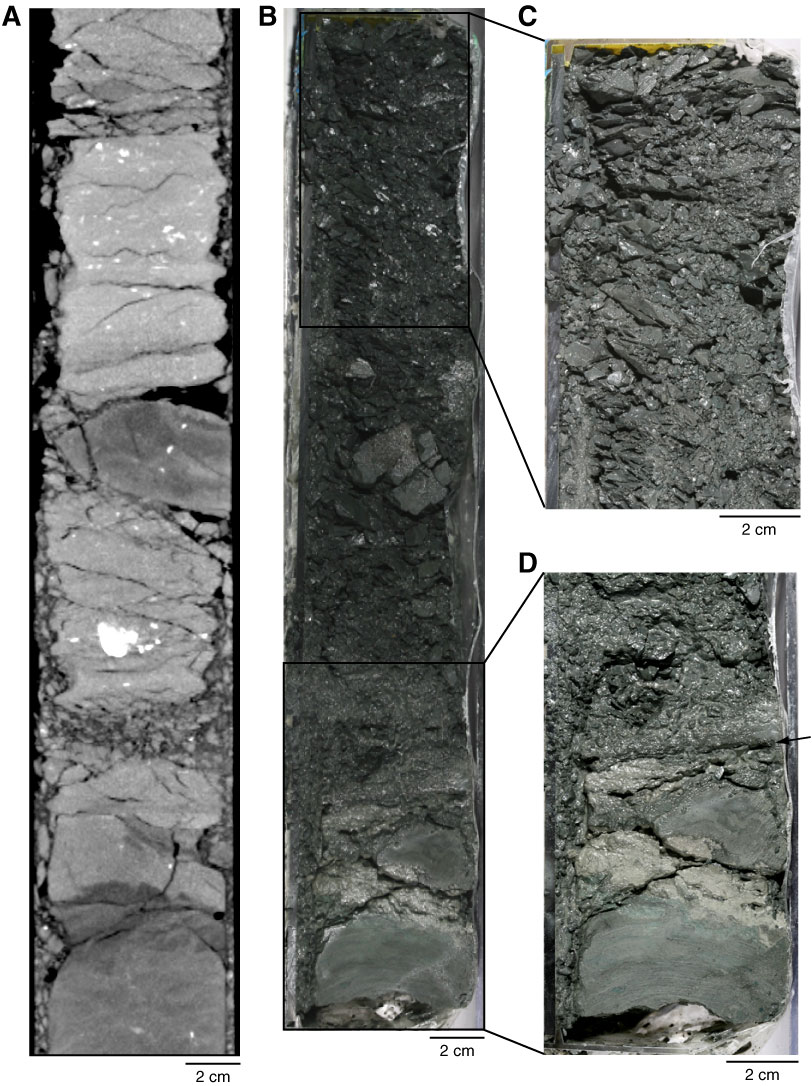
Figure F32. Appearance of concentrated deformation in lower portion of fault Zone 3. (A) CT image and (B) core photograph of finely brecciated hemipelagic mudstone (interval 316-C0007D-29R-2, 37–73 cm). C. Close up of finely brecciated interval. D. Thin (2 mm thick) dark layer (arrow) developed at base of finely brecciated interval.
Previous | Close | Next | Top of page