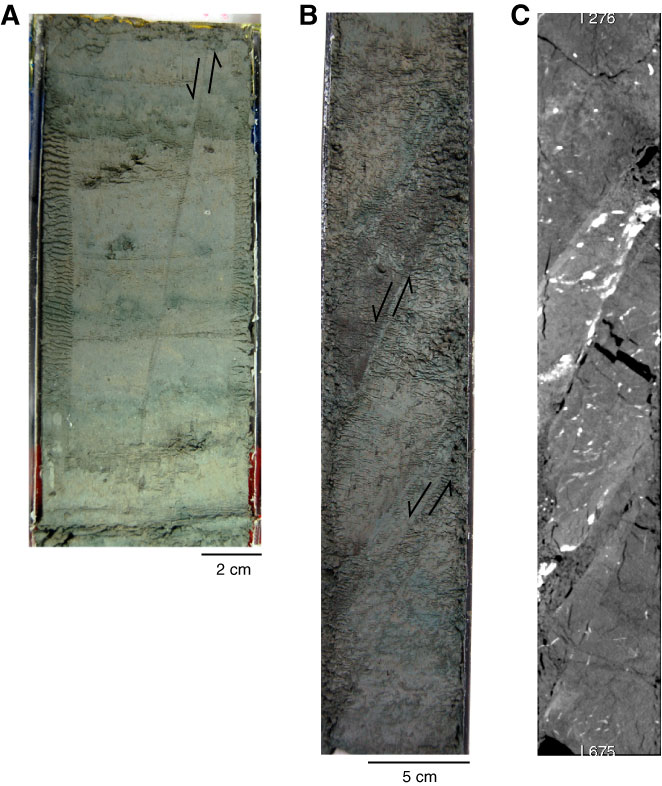
Figure F12. Core photographs showing normal faults, Site C0008. A. Interval 316-C0008A-4H-9, 60–77 cm. B. Interval 316-C0008C-5H-7, 29–66 cm. C. CT image of B. Bright spots possibly correspond to pyrite deposits. Black arrows = sense of shear.
Previous | Close | Next | Top of page