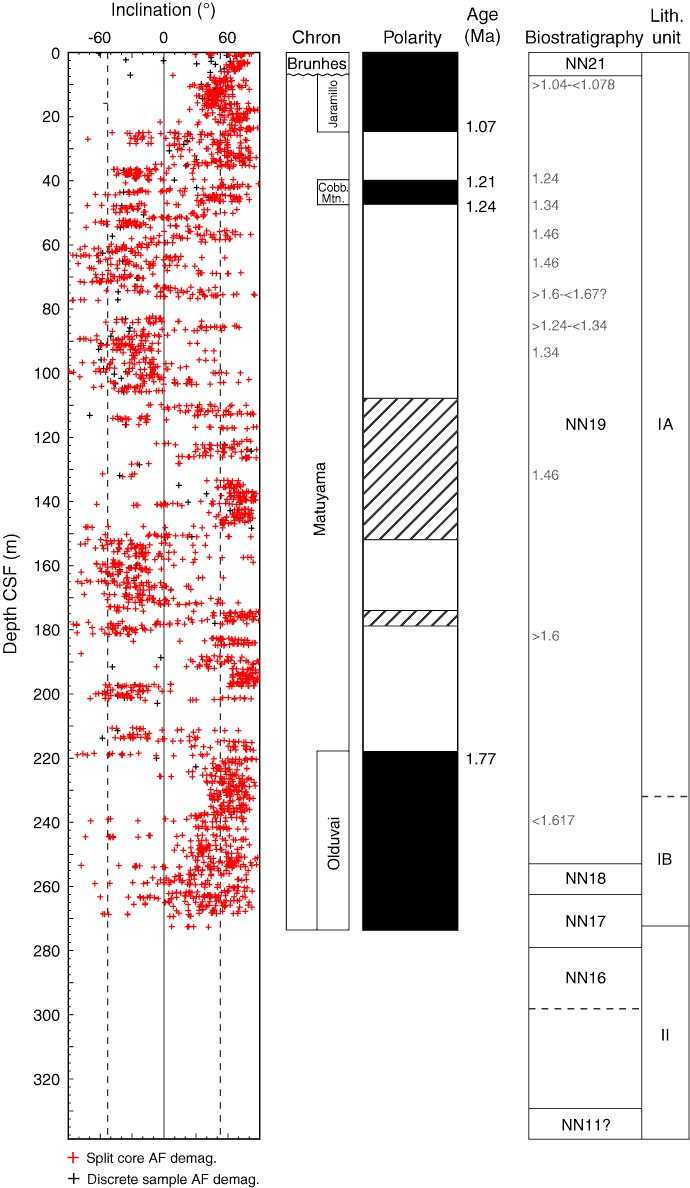
Figure F22. Downhole variation in stable magnetic inclination, inferred polarity, biostratigraphic zones, and lithology for sediments in Hole C0008A. CSF = Core depth below seafloor. Black areas = normal polarity, white areas = reversed polarity, hatched area = mixed or uncertain polarity. Gray text = age from foraminiferal zonation. Black crosses in the inclination plot = alternating field (AF) or thermal demagnetization data of discrete samples.

Previous | Close | Next | Top of page