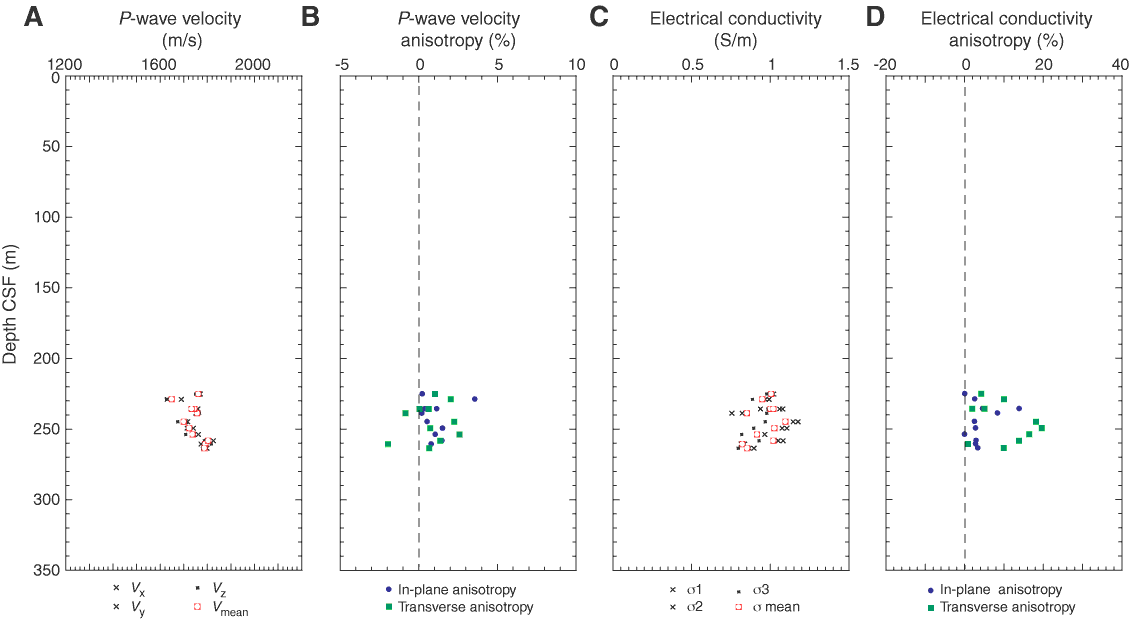
Figure F35. Measurements on discrete samples, Hole C0008A. A. P-wave velocity. Black crosses = individual measurements, black squares = measurements along core axis, red squares = average velocity per sample. B. P-wave velocity anisotropy. For transverse anisotropy, positive values equal lower magnitude along the core axis. C. Electrical conductivity. D. Electrical conductivity anisotropy. CSF = core depth below seafloor.

Previous | Close | Next | Top of page