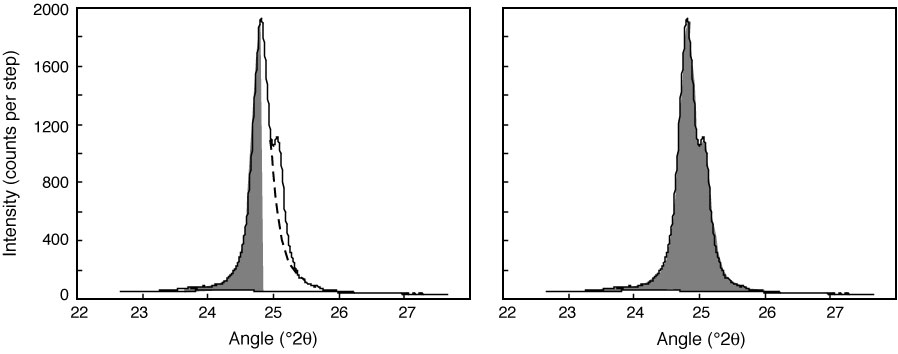
Figure F2. X-ray diffractogram of a typical kaolinite and chlorite standard mixture. The regions highlighted in gray show how to measure the half peak area and the total peak area. The dashed line helps outline the dominant peak.
Previous | Close | Next | Top of page