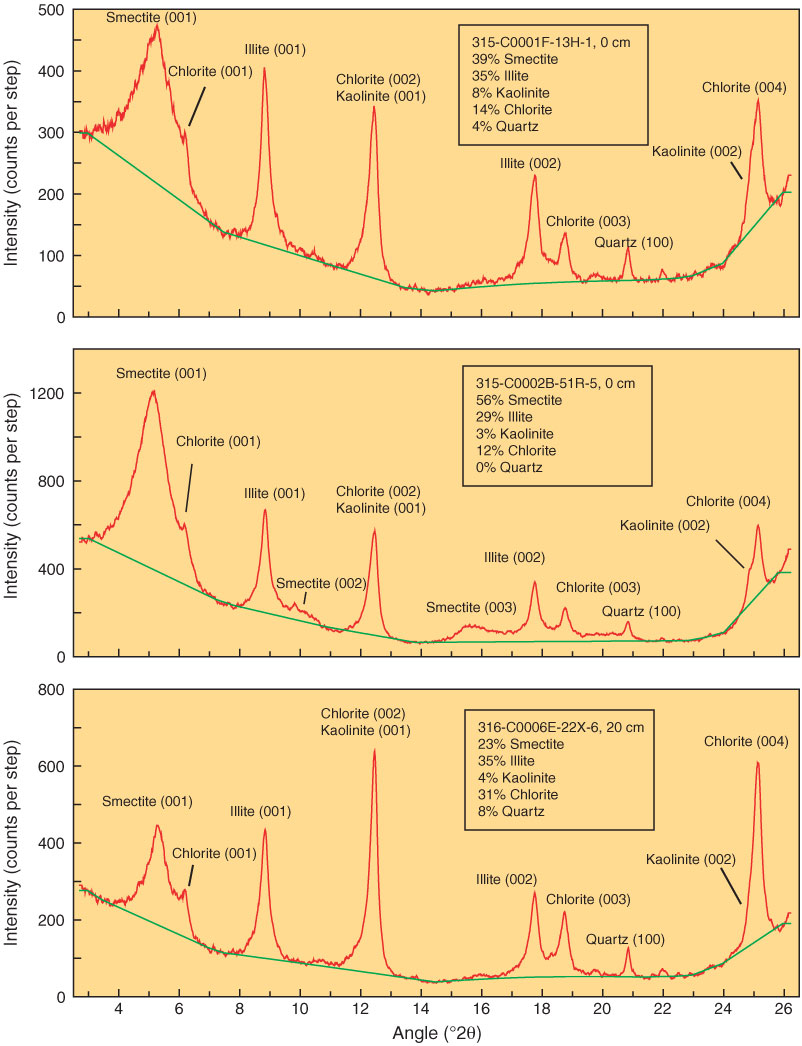
Figure F3. Representative examples of X-ray diffractograms showing peaks for smectite, illite, chlorite, kaolinite, and quartz. Values of relative mineral abundance (wt%) were calculated using the singular value decomposition (SVD) normalization factors of Underwood et al. (2003) and the following peak areas: smectite (001), illite (001), chlorite (002) + kaolinite (001), and quartz (100). The proportion of kaolinite to chlorite was calculated using the equations of Guo and Underwood (2011).
Previous | Close | Next | Top of page