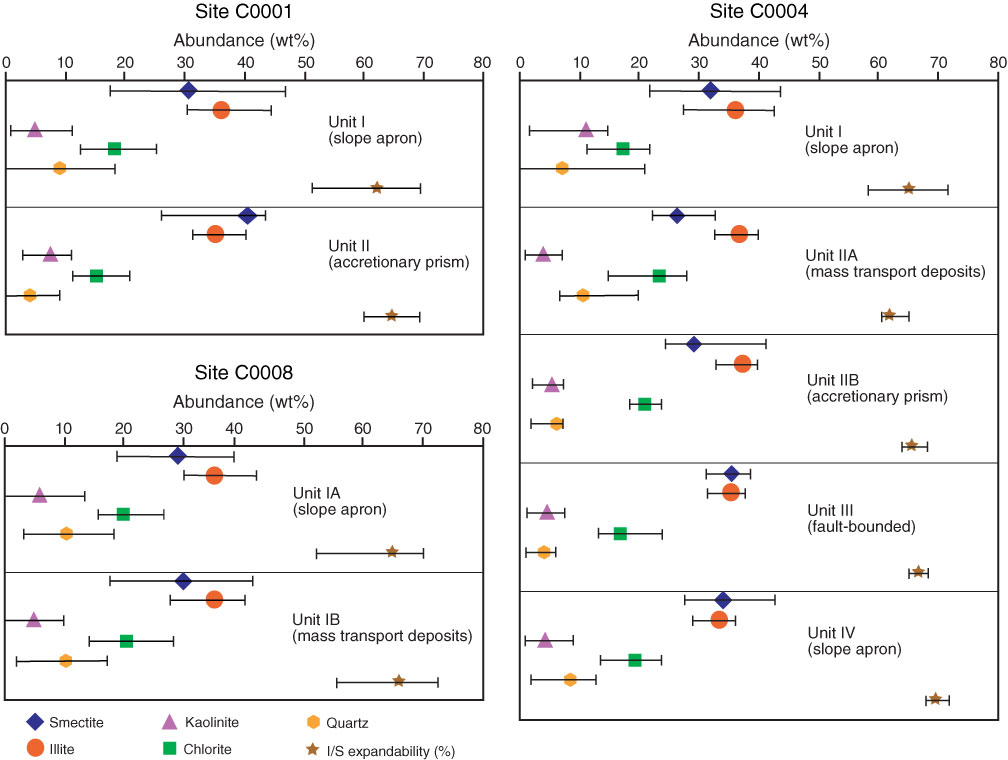
Figure F7. Maximum, minimum, and average values of relative mineral abundances (wt%) for different lithologic units in the shallow megasplay domain (Sites C0001, C0004, and C0008). Solid symbols represent the average, and bars extend from minimum to maximum values. I/S = illite/smectite.
Previous | Close | Next | Top of page