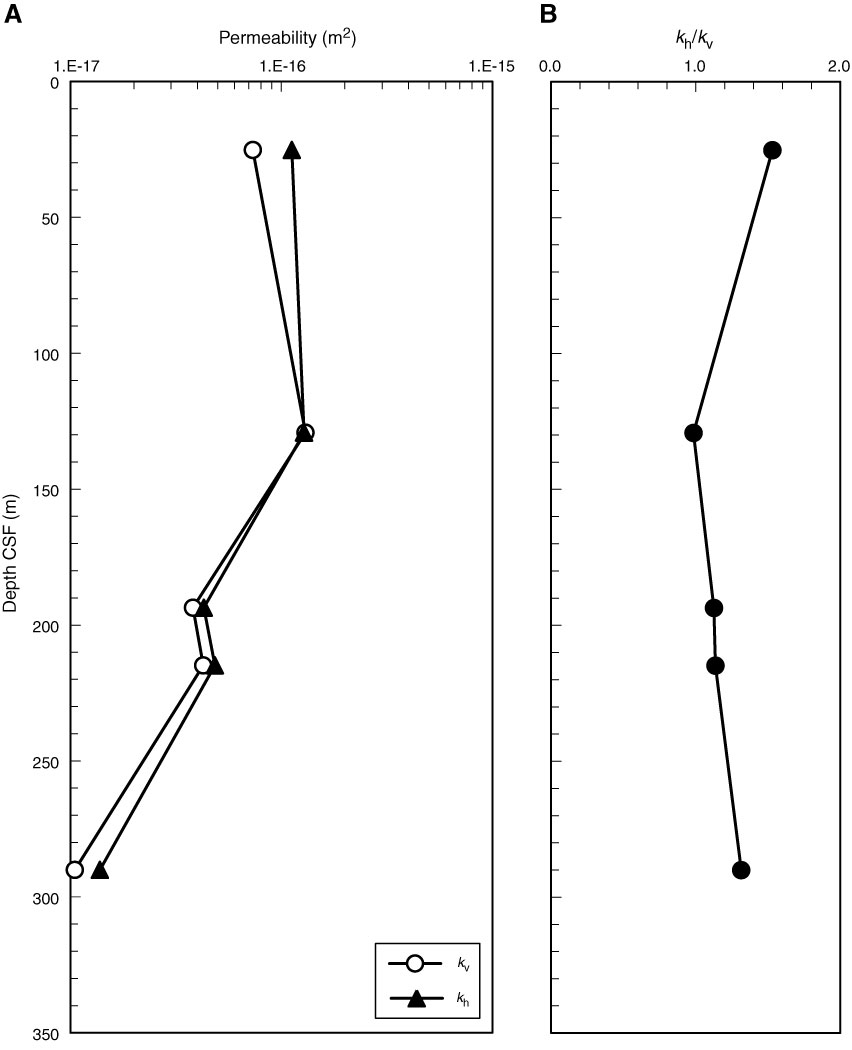
Figure F7. A. Vertical and horizontal permeability values with depth for samples collected from Site C0001. B. Anisotropy ratio for permeability (horizontal/vertical) as a function of depth, calculated at the highest testing value of effective stress (0.55 MPa).
Previous | Close | Next | Top of page