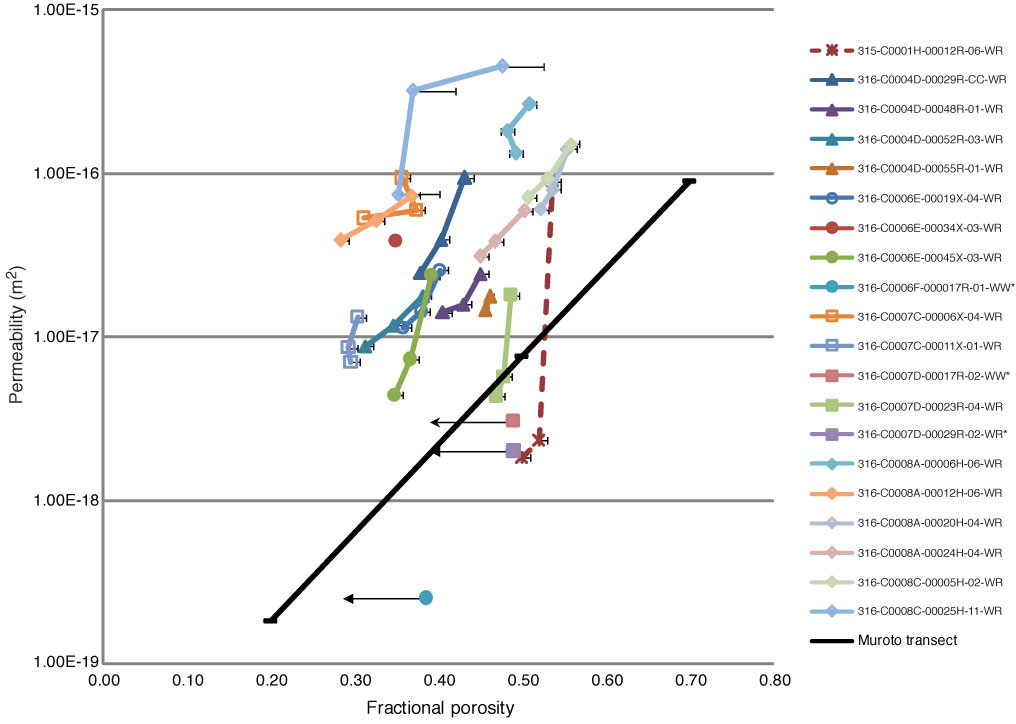
Figure F3. Plot of measured permeability as a function of porosity, Sites C0001, C0004, C0006, C0007, and C0008. Open symbols = samples containing sand or ash, solid symbols = more clayey samples. * = 2.54 cm (1 inch) diameter samples. Porosity change due to consolidation could not be estimated for these samples; permeability from the first consolidation step is shown plotted against initial (shipboard) porosity. For comparison, the inferred porosity permeability relationship (log(k) = 19.82 + 5.39n) from the Muroto transect (Gamage and Screaton, 2006) is shown.
Previous | Close | Next | Top of page