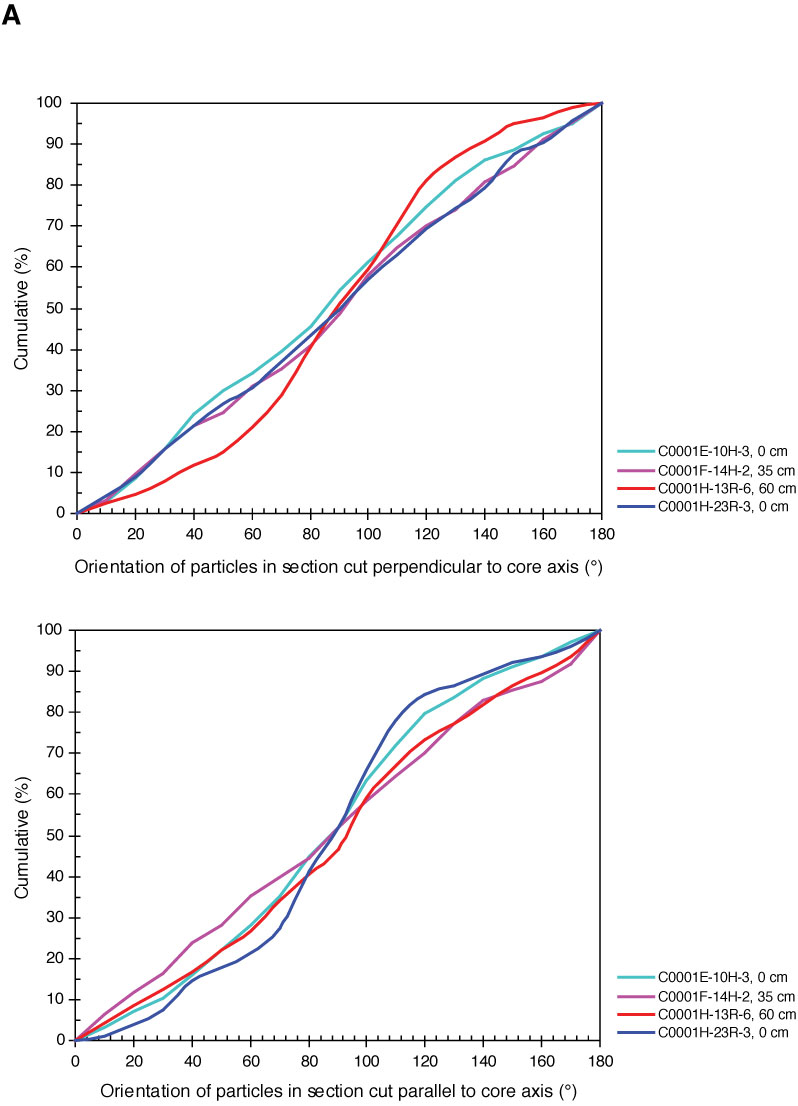
Figure F5. Cumulative orientation frequency curve of samples from Sites C0001, C0004, C0006, C0007, and C0008. The number of values in each bin (10°) was summed and normalized to 100%. A. Site C0001. (Continued on next four pages.)

Previous | Close | Next | Top of page