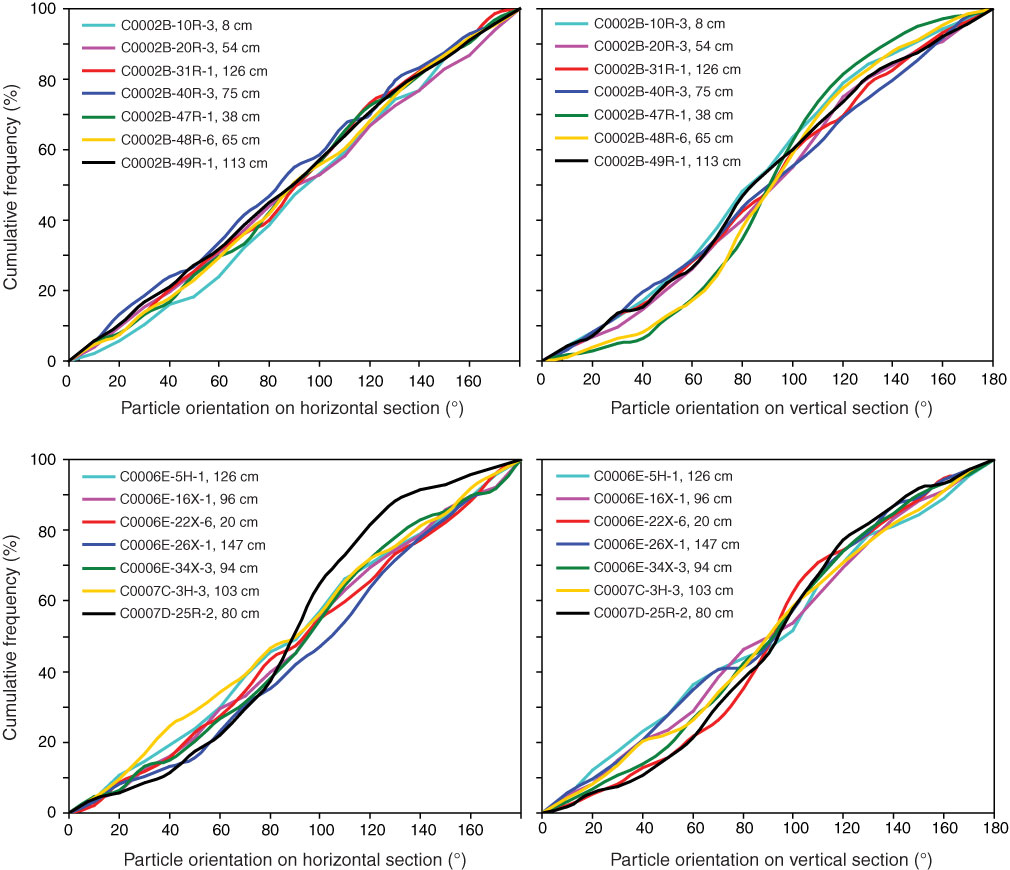
Figure F10. Cumulative frequency curves showing orientation of particles (apparent long axis) on horizontal and vertical sections of samples from Sites C0002, C0006, and C0007. The number of values in each bin (10°) was summed and normalized to 100%.
Previous | Close | Next | Top of page