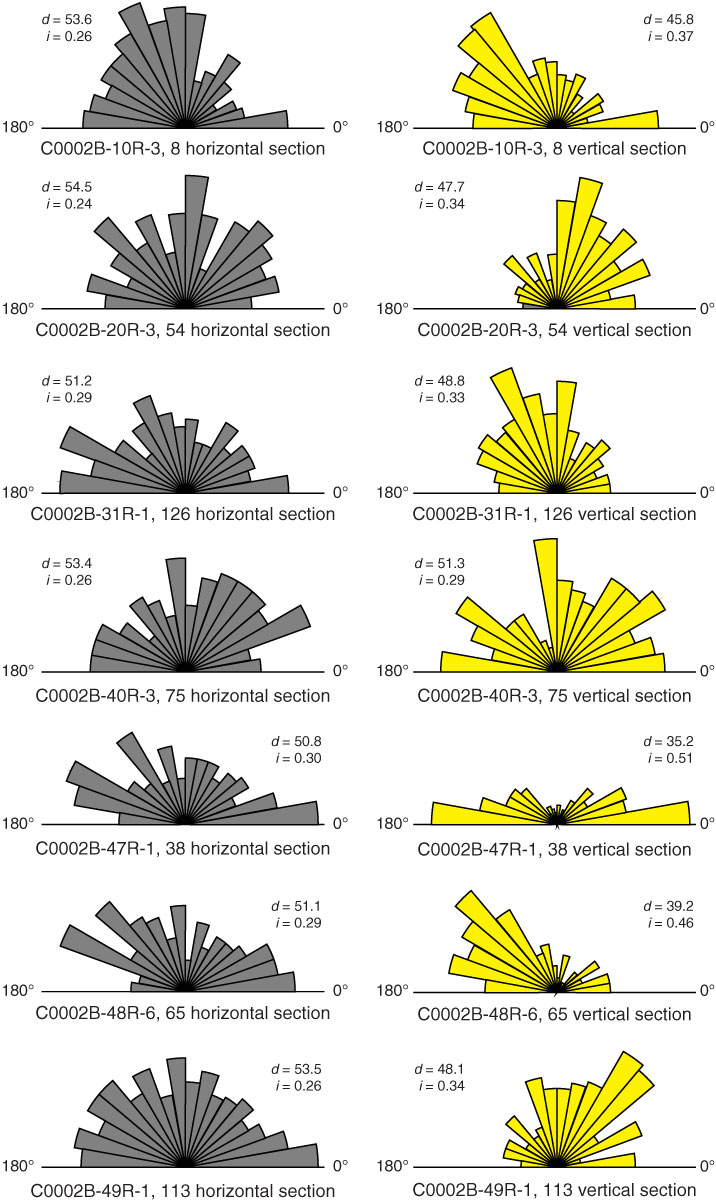
Figure F9. Rose diagrams showing orientation of particles (apparent long axis) on horizontal and vertical sections of samples from Sites C0002, C0006, and C0007. d = standard deviation of particle orientation (°) and i = index of orientation. (Continued on next page.)
Previous | Close | Next | Top of page