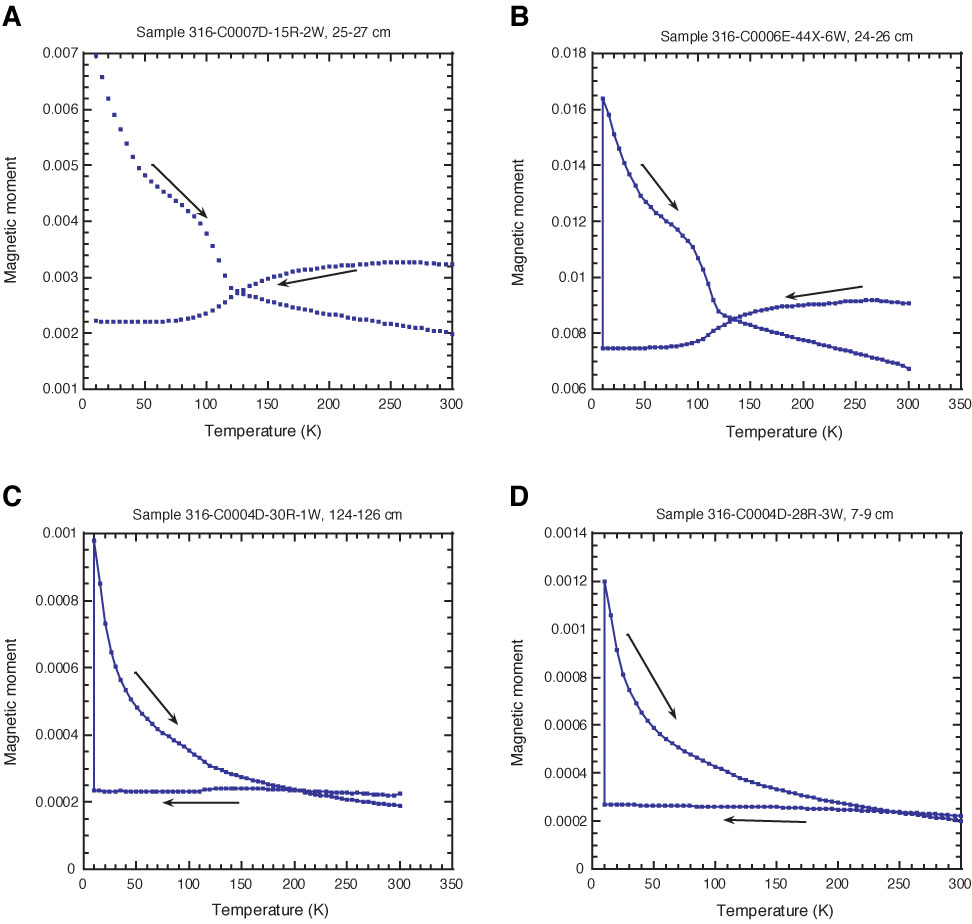
Figure F10. Low-temperature variations of saturation isothermal remanence for several representative samples during zero-field cooling from 300 to 10 K and zero-field warming back to 300 K that display behavior of different groups of low-temperature magnetometry (see text). Directions of arrows indicate heating and cooling curves. A. Sample 316-C0007D-15R-2W, 25–27 cm. B. Sample 316-C0006E-44X-6W, 24–26 cm. C. Sample 316-C0004D-30R-1W, 124–126 cm. D. Sample 316-C0004D-28R-3W, 7–9 cm.
Previous | Close | Top of page