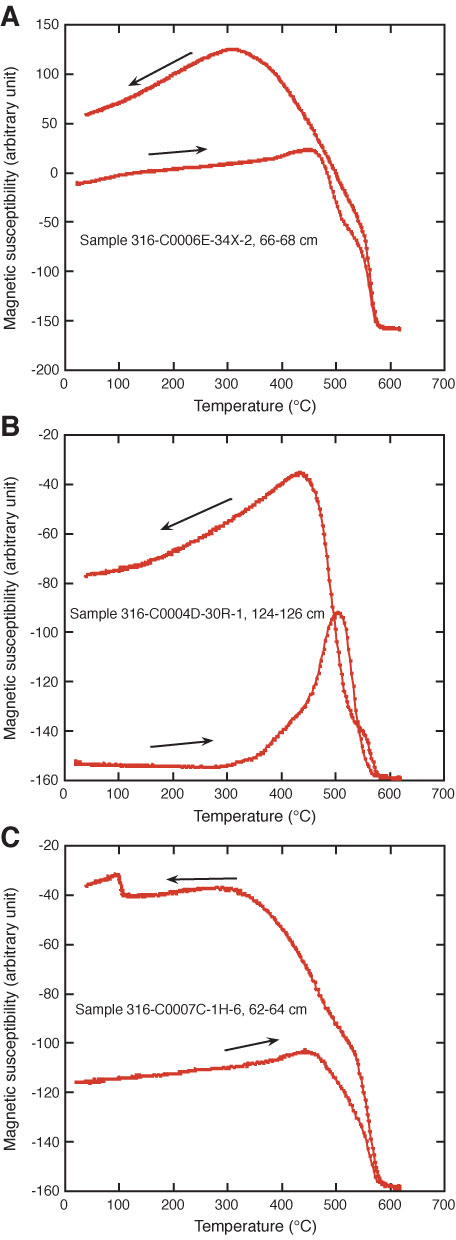
Figure F8. Typical thermomagnetic curves for representative samples. Directions of arrows indicate heating and cooling curves. A. Sample 316-C0006E-34X-2, 66–68 cm. B. Sample 316-C0004D-30R-1, 124–126 cm. C. Sample 316-C0007C-1H-6, 62–64 cm.
Previous | Close | Next | Top of page