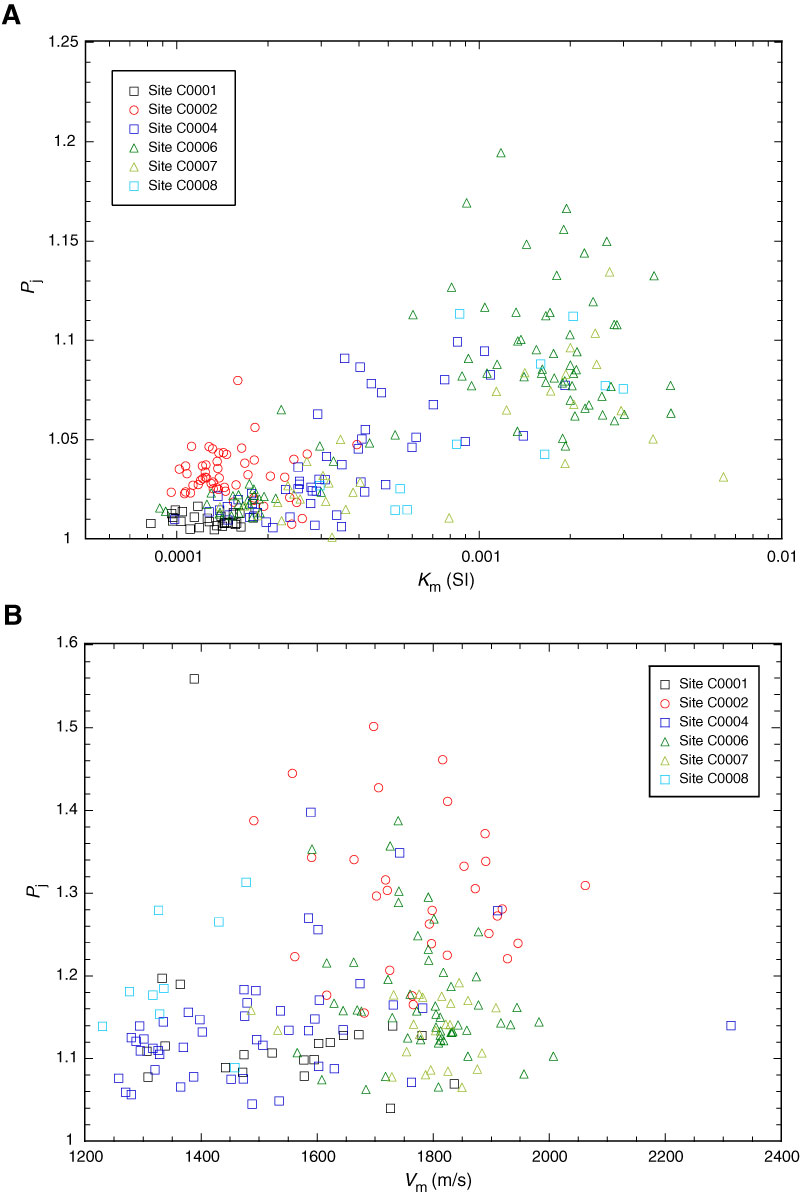
Figure F3. A. Jelinek anisotropy parameter (Pj) vs. mean magnetic susceptibility (Km). B. Jelinek anisotropy parameter (Pj) vs. mean P-wave velocity (Vm). Data labels are ordered according to a northwest–southeast profile.
Previous | Close | Next | Top of page